-
 The Grant Team Project Edit Rights workflow allows a project manager to grant Project – Edit Management rights to all users staffed on the project. This workflow saves not only the project manager time by allowing all users on the project to update information, but also saves the administrator time from granting each resource these rights individually. The process will also remove any rights from members that have been removed from the project.
 -
 The Timesheet Approval - RM and PM process is an auto-start process that begins once the resource submits his or her timesheet. This process provides a checks-and-balances style to ensure that all resources entering time have entered the 40 hours. Once the timesheet is submitted, the process will lock the user’s timesheet to prevent editing. The process will then select the next action based on three different factors:
- The timesheet has less than 40 hours.
- The timesheet has 40 or more hours.
- The resource’s availability is less than 8hrs/day.
-
 Looking for more value in Open Workbench? Learn tricks to decrease the time you spend on project management, as well as best practices around plans, baselines, and dependencies.
 -
 Are you starting a demand/portfolio management implementation, or do you want to compare how you are using these functions vs. others or best practices? In this class we will discuss some best practices from successful customers.
 -
 Course Description: Do you want to analyze the cost and utilization of Agile development resources? Do you struggle to integrate financial information with work execution information from Agile tools such as Rally Software®, Jira, or VersionOne? This session explores reporting and dashboarding approaches to provide technology leaders with KPIs and trends for Agile execution, along with views that relate Agile team activity with cost and delivery.
 -
 Course Description: Are your project teams using SharePoint effectively and getting the most value out of it? Is document management a daily struggle? Learn how to use SharePoint with Clarity PPM to seamlessly improve collaboration and team productivity.
 -
 Would you like to get an overview of the fundamentals of Agile? This session will dispel the misconceptions of Agile and provide an understanding and definition of terms such as “bi-modal”, “Scrum”, “Kanban”, “weighted shortest job first” and “SAFe”. We will also talk about how Clarity fits into the Agile discussion and provide thoughts and practices on how PMOs are responding to this trending methodology.
 -
 Agile metrics can be very different from traditional waterfall metrics. This session will walk through some of the key Agile metrics describing how and why they are used. Effective methods in reporting and sharing will also be covered.
 -
 This portlet displays the % allocation of resources to projects. The portlet shows if the resource is allocated to the projects as an individual resource or as part of an Agile team, in which case it will display the resource % allocation to the team and what that will represent in terms of % allocation to the project. The Total Allocation % display the allocation of the resource to all investments is allocated to. Remaining Capacity and Over/Under columns will help identify the resources that still have availability and the ones that are over allocated.
 -

This portlet displays the monthly allocation per resource. The PM can view by the RM or the resource to get the data for monthly resource allocations. The table below describes the available filter fields in the portlet. Column Label Description Work Effort Manager Manager of the Investment the Work Effort is on Work Effort Active Active status of the Investment the Work Effort is on Resource Resource’s Name Internal Resource ID Resource’s ID Zero Allocation Show Allocations that equal zero Open for Time Entry Is the Resource Open for Time Entry Resource Active Resource’s Active status Role Resource’s Primary Role OBS Unit Resource’s OBS Start Allocation Start Time to filter by End Allocation Finish time to filter by -
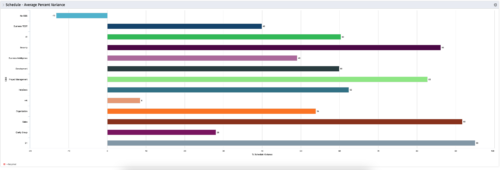 This is a graphic portlet that pulls the average schedule variance by OBS node of the project. The portlet allows you to choose any OBS that is associated to the Project Object. Users can filter by:
- OBS Type
- If the project is financially approved?
- Financial Status
-
 Part of the Business Transformation collection, this bar-chart portlet displays number of investments per stage. This provides a holistic overview of where the projects are within the organization.


Copyright 2023 • Rego Consulting Corporation • Privacy Policy