-
 This training document is a Rego Consulting Quick Reference Guide to assist with utilization of the Staffing page in Clarity’s Modern User Experience. This doc references version 16.0.3 views. Document provides detail on the layout and capabilities of the Staff Grid as well as the Allocations Timeline. Information is provided on columns, widgets and filtering. Instructions are provided on how to save Views. Summary information is provided on the layout of the Allocation Timeline and includes detail on the Investment Timeline and the Resource Histogram. Investment Timeline summary contains information on the Allocations by Investments and the Allocations by Resources tabs. While the Resource Histogram section provides screenshots on Resource Availability and Resources by Role.
 -
 This training document is a Rego Consulting Quick Reference Guide to assist with the use of the Staffing Plan in Clarity’s Modern User Experience. This doc references version 16.0.3 views. Document provides information on how to swap between views to see investments by resource or resources by investment. Instructions on filtering are provided, as well as detail on how to update the unit of measure between FTE (Full Time Equivalent) and Hours. Tips are provided on how to expand the list of investments within each view and how to view the properties for the allocations. A Legend is also documented to provide information on each of the icons that are displayed on this page.
 -
 This training document is a Rego Consulting Quick Reference Guide to assist with the management of Roadmap items within the Grid View in Clarity’s Modern User Experience. This doc references version 16.0.3 views. Instructions are provided to help users add and remove columns, move columns, pin columns and sort rows of data. The document provides guidance on how to use the View Options function to manage Per-Period Metrics. Includes guidance on how to update Roadmap data from the Grid View and how to use the In Plan column to rank investments.
 -
 This training document is a Rego Consulting Quick Reference Guide to assist with the management of the Grid View within Hierarchies in Clarity’s Modern User Experience. This doc references version 16.0.3 views. Document covers information on how to export to CSV, filter, create and save Views, use of the Column Panel and the Details panel.
 -
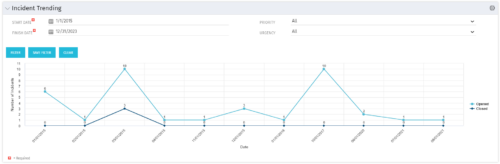 The Incident Trending portlet all opened and closed incidents within a certain time frame. This portlet will show trends in incidents over previous months and allows for analysis of as to the root cause in a spike of incidents. The information may be filtered by date range, urgency and priority.
 -
The Incident Trending portlet all opened and closed incidents within a certain time frame. This portlet will show trends in incidents over previous months and allows for analysis of as to the root cause in a spike of incidents. The information may be filtered by date range, urgency and priority.
-
The Incident Trending portlet all opened and closed incidents within a certain time frame. This portlet will show trends in incidents over previous months and allows for analysis of as to the root cause in a spike of incidents. The information may be filtered by date range, urgency and priority.
-
 An HTML portlet that displays two buttons that link the user instantly to an object create page. The portlet comes with two buttons and the buttons can be modified to link to any creation page. Administrator can choose: Project, Idea, Application, Program, etc.
 -
An HTML portlet that displays two buttons that link the user instantly to an object create page. The portlet comes with two buttons and the buttons can be modified to link to any creation page. Administrator can choose: Project, Idea, Application, Program, etc.
-
 This grid portlet to show projects with finish or start date of project more than 20 years in future or past. The portlet automatically displays results when accessed. The user can apply filters to fetch the desired information.
 -
This grid portlet to show projects with finish or start date of project more than 20 years in future or past. The portlet automatically displays results when accessed. The user can apply filters to fetch the desired information.
-
 Part of the Business Transformation collection, this grid portlet displays idea details for all ideas (active and inactive) and all status conditions. This is an editable portlet based on the Ideas data provider. Filterable by OBS structure, Active/Inactive, and Status.
 -
Part of the Business Transformation collection, this grid portlet displays idea details for all ideas (active and inactive) and all status conditions. This is an editable portlet based on the Ideas data provider. Filterable by OBS structure, Active/Inactive, and Status.
-
Part of the Business Transformation collection, this grid portlet displays idea details for all ideas (active and inactive) and all status conditions. This is an editable portlet based on the Ideas data provider. Filterable by OBS structure, Active/Inactive, and Status.
-
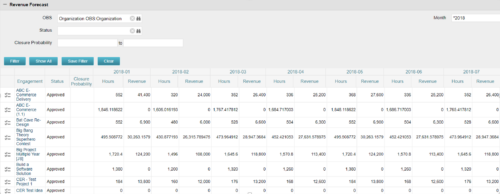
The Revenue Forecast portlet displays projected revenue at a project level broken out by month. This portlet assists in viewing all project revenue data at once and making it easily exportable. The table below describes the available filter fields in the portlet. Column Label Description OBS OBS to filter projects with Status Status of the project Closure Probability ? Months Month(s) of Project Revenue to display -
The Revenue Forecast portlet displays projected revenue at a project level broken out by month. This portlet assists in viewing all project revenue data at once and making it easily exportable. The table below describes the available filter fields in the portlet. Column Label Description OBS OBS to filter projects with Status Status of the project Closure Probability ? Months Month(s) of Project Revenue to display -
The Revenue Forecast portlet displays projected revenue at a project level broken out by month. This portlet assists in viewing all project revenue data at once and making it easily exportable. The table below describes the available filter fields in the portlet. Column Label Description OBS OBS to filter projects with Status Status of the project Closure Probability ? Months Month(s) of Project Revenue to display -
 This video provides an overview of utilizing the various views available within Open WorkBench. The video is available in both .m4v and .wmv formats.
 -
 This video describes the process of creating new tasks and working with the Work Breakdown Structure (WBS) within Open WorkBench. The video is available in both .m4v and .wmv formats.
 -
 This video describes how to create and work with task dependencies within Open WorkBench. The video is available in both .m4v and .wmv formats.
 -
 This video describes the process to assign resources to tasks within OWB. The video is available in both .m4v and .wmv formats.
 -
 This video describes the process of transferring assignments from one resource to another resource of the same type (e.g., labor to labor, equipment to equipment) using the Transfer Assignments Wizard in OWB. The video is available in both .m4v and .wmv formats.
 -
 This video describes the process either a Start or Finish date on a project in OWB. The date (start or finish) will determine the point from which all tasks in the project are then scheduled. The video is available in both .m4v and .wmv formats.
 -
 This video describes the process to Autoschedule a project using OWB. The video is available in both .m4v and .wmv formats.


Copyright 2023 • Rego Consulting Corporation • Privacy Policy