-
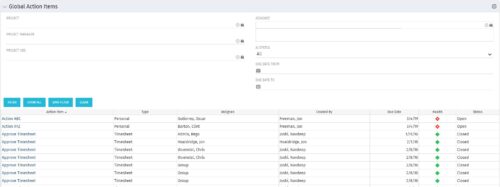 The Global Action Items portlet will help users and clarity admins to keep track of action items in the CA PPM system. This is useful to keep track of Timesheet Approval through Action Item or any other Action Item related workflows. The portlet displays Name, Type Assignee, Created by, Due Date, Health and Status of the Action Items as default columns. The portlet provides Project, Project Manager, Project OBS, Assignee, Status and Due Dates of the Action Items as default filters.
 -
 Course Description: Are your project teams using SharePoint effectively and getting the most value out of it? Is document management a daily struggle? Learn how to use SharePoint with Clarity PPM to seamlessly improve collaboration and team productivity.
 -
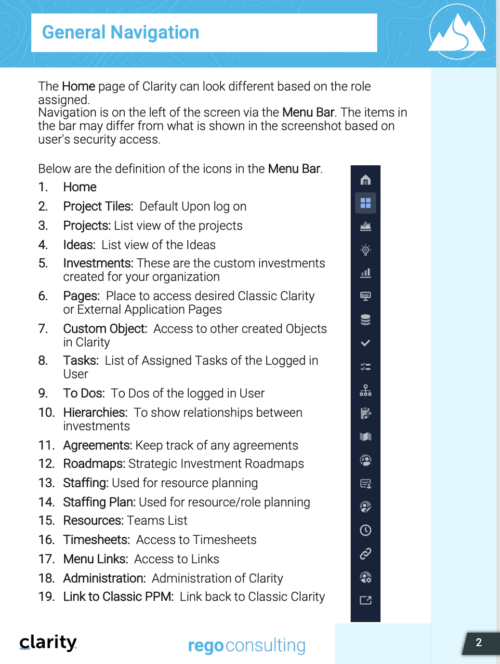
 This training document is a Rego Consulting Quick Reference Guide to assist with General Navigation in Clarity’s Modern User Experience. This doc references version 16.0 views. Doc reviews the Menu Bar and User Tool Bar.
 -
 Funnel Chart displays aggregated counts of Ideas by “Idea Progress”, a custom attribute. Chart shows Idea Progress names in legend, and count total is available as a mouse-over. No filters available on this portlet.
 -
Funnel Chart displays aggregated counts of Ideas by “Idea Progress”, a custom attribute. Chart shows Idea Progress names in legend, and count total is available as a mouse-over. No filters available on this portlet.
-
Funnel Chart displays aggregated counts of Ideas by “Idea Progress”, a custom attribute. Chart shows Idea Progress names in legend, and count total is available as a mouse-over. No filters available on this portlet.
-
 Aligning work to organizational strategy is a fundamental requirement in today's ever-changing marketplace. High performing organizations are moving beyond basic connections to introduce strategic hierarchies that are tied to real measurements of business value via Clarity's Objectives and Key Results (OKRs). Join our expert guides as they present key concepts, best practices, and the evolution of strategic alignment.
 -
 The Financial Summary by Transaction Class provides a visual graph for each year’s financial picture for multiple years. Report contains the following items: KPIs: Displays total benefit, capital, expense and net cash flow for the selected filter criteria Grid: Displays year wise break up of benefit, capital, expense and net cash flow for the selected filter criteria Graph: Benefit, capital, expense and net cash flow are depicted in graphical way for multiple years. This report will show the user where they need to concentrate their efforts in order to meet financial commitments. User can further narrow their search by OBS Type & Path.
 -
 This configuration and accompanying process allows users to capture Financial and Non-Financial (Metrics, Soft, etc.) Benefit in a custom sub-object, then programmatically create an out-of-the-box Benefit Plan with just the Financial Portion from the custom sub-object. The solution is comprised of:
- Sub-Object (Benefit Plan Details, Parent = Project)
- Process: Create Benefit Plan (uses sub-object as primary input, native BP is output)
- Process: Update sql - Cost Benefit Plans (one-time script to update Projects)
- Ensure on the Benefit Details List view the Planned and Realized Amounts are displayed
- Modifying the Create Benefit Plan Process in support of a BP naming convention consistent with local PMO Practices
- Modifying the Create Benefit Plan Process to link the BP to the Cost Plan of Record
- Creating a Portlet that pulls together rows of data from the sub-object across multiple projects in a summarized view as well as a detailed view
-
This configuration and accompanying process allows users to capture Financial and Non-Financial (Metrics, Soft, etc.) Benefit in a custom sub-object, then programmatically create an out-of-the-box Benefit Plan with just the Financial Portion from the custom sub-object. The solution is comprised of:
- Sub-Object (Benefit Plan Details, Parent = Project)
- Process: Create Benefit Plan (uses sub-object as primary input, native BP is output)
- Process: Update sql - Cost Benefit Plans (one-time script to update Projects)
- Ensure on the Benefit Details List view the Planned and Realized Amounts are displayed
- Modifying the Create Benefit Plan Process in support of a BP naming convention consistent with local PMO Practices
- Modifying the Create Benefit Plan Process to link the BP to the Cost Plan of Record
- Creating a Portlet that pulls together rows of data from the sub-object across multiple projects in a summarized view as well as a detailed view
-
 The Executive Dashboard portlet displays information regarding projects the user has security rights to view. It provides a one-stop place for the PMO or management to view all critical information about projects. The portlet not only displays status indicators as well as dates for late items, variances and days late, but also displays the project status fields from the Status Report sub-object.
 -
The Executive Dashboard portlet displays information regarding projects the user has security rights to view. It provides a one-stop place for the PMO or management to view all critical information about projects. The portlet not only displays status indicators as well as dates for late items, variances and days late, but also displays the project status fields from the Status Report sub-object.
-
 Does project and idea estimation take too long and lack visibility? This class will address one of the most common pain points within organizations: how to involve the right people within a timely project estimate. Learn some Rego best practices for defining, calculating, and modifying idea and project estimates, so you can increase throughput and ROI.
 -
 A presentation slide deck from Rego University 2022. The course discusses factors that differentiate Requirements.
- Introduction (What & Why)
- Definition & Uses of Requirements
- The Challenges in Requirements in Software
- Revisit the Agile Taxonomy
- The Transition from Traditional to Agile
- Rethink the Agile Portfolio
- Guidelines and Characteristic of Taxonomy
-
 This training document is a Rego Consulting Quick Reference Guide to assist with the process of entering and submitting timesheets in Clarity’s Modern User Experience. The document reviews Accessing and Selecting Timesheets, Population of the Timesheet, and Updating Time & Submitting.
 -
 A presentation slide deck from Rego University 2022. The document covers Doing Agile, Agile Manifesto and then Being Agile.
 -
 Course description: “How are other companies storing or managing documents? This session will discuss options for using native CA PPM, linking to SharePoint, connecting directly to SharePoint, using Google docs, as well as other options. This session will also discuss options for document approval workflows within CA PPM for both collaborative documents and attachment fields.” Download file is the slide deck used during the presentation.
 -
 Discount Tire shares their Project Prioritization Model. It’s based on the Analytic Hierarchy Process (AHP) created in the 1970’s. It breaks down decisions into a hierarchal structure and combines both objectivity and subjectivity into a standard numerical scale.
 -
 Are you starting a demand/portfolio management implementation, or do you want to compare how you are using these functions vs. others or best practices? In this class we will discuss some best practices from successful customers.
 -
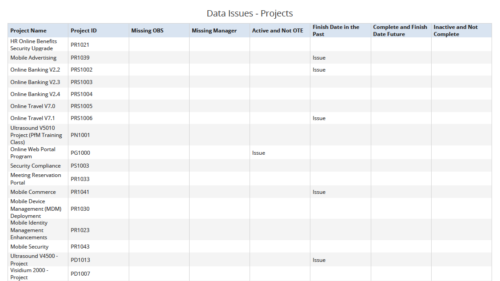 Data Issues – Projects report displays data exceptions related to projects. Data exceptions could be missing data or data not in required format for those project fields. User can further narrow their search by OBS Type & Path, Project Name, Project ID and Project Type.
 -
 The Dashboard: Project Status Single-line portlet gives an overview of the project overall status as well as the status indicators on the "current" status report object. The portlet will pull the "id" from the page it is placed on, so this portlet is usually placed on the project dashboard tab. This portlet displays the report date, symbols relating to the overall status, scope, schedule, cost/effort, and the overall explanation across a single line in the portlet.
 -
The Dashboard: Project Status Single-line portlet gives an overview of the project overall status as well as the status indicators on the "current" status report object. The portlet will pull the "id" from the page it is placed on, so this portlet is usually placed on the project dashboard tab. This portlet displays the report date, symbols relating to the overall status, scope, schedule, cost/effort, and the overall explanation across a single line in the portlet.


Copyright 2023 • Rego Consulting Corporation • Privacy Policy