-
 The Grant Project Edit Rights workflow process allows a project manager to grant project edit rights to another user without contacting an administrator. The workflow uses the Out-of-the-box field for Business Owner. The script starts when the field is updated. It will assign project edit rights to whichever user is added to the Business Owner field. This process can be modified to grant project edit rights to any user within a project field.
 -
 Course Description: Are you struggling to implement Agile tools at your organization alongside Clarity PPM? This class will review best practices for implementing Agile tools in conjunction with Clarity PPM while living in a bimodal world. We will discuss how Clarity PPM can govern both types of work and teams and how Agile tools should interface with Clarity PPM.
 -
 By its very nature, the shift to Product Funding is going to require that tracking of that funding. Agile tools do not have much, if any, financial capabilities, so it is important to create an eco-system that can support this value stream—from funding, through delivery, and finally to tracking the realization of financial value. Learn how Rally and Clarity PPM do this very well together.
 -
 This portlet displays the % allocation of resources to projects. The portlet shows if the resource is allocated to the projects as an individual resource or as part of an Agile team, in which case it will display the resource % allocation to the team and what that will represent in terms of % allocation to the project. The Total Allocation % display the allocation of the resource to all investments is allocated to. Remaining Capacity and Over/Under columns will help identify the resources that still have availability and the ones that are over allocated.
 -

This portlet displays the monthly allocation per resource. The PM can view by the RM or the resource to get the data for monthly resource allocations. The table below describes the available filter fields in the portlet. Column Label Description Work Effort Manager Manager of the Investment the Work Effort is on Work Effort Active Active status of the Investment the Work Effort is on Resource Resource’s Name Internal Resource ID Resource’s ID Zero Allocation Show Allocations that equal zero Open for Time Entry Is the Resource Open for Time Entry Resource Active Resource’s Active status Role Resource’s Primary Role OBS Unit Resource’s OBS Start Allocation Start Time to filter by End Allocation Finish time to filter by -
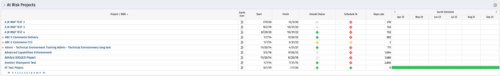 Part of the Business Transformation collection, this bar-chart portlet displays investments and (if exists) any child investments, which are at risk with regard to the schedule of the investments.
 -
 Funnel Chart displays aggregated counts of Ideas by “Idea Progress”, a custom attribute. Chart shows Idea Progress names in legend, and count total is available as a mouse-over. No filters available on this portlet.
 -
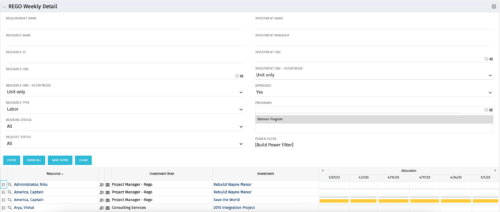 This is the same portlet as the out of the box Weekly Detail with an additional filter element for Program (multiple select). Portlet displays resource allocations graphically for each project in the specified program(s), for the next six weekly periods. Portlet filterable by numerous project, resource, and assignment attributes. Graphical representation shows Resource Availability Threshold and Allocation in hours, as a mouse-over.
 -
 The Dashboard: Project Information portlet gives a set of high-level information about the project. The portlet will pull the "id" from the page it is placed on, so this portlet is usually placed on the project dashboard tab. The portlet displays the name, project ID, project manager, description, start date, finish date, baseline start, and baseline finish.
 -
 The Dashboard: Project Status Single-line portlet gives an overview of the project overall status as well as the status indicators on the "current" status report object. The portlet will pull the "id" from the page it is placed on, so this portlet is usually placed on the project dashboard tab. This portlet displays the report date, symbols relating to the overall status, scope, schedule, cost/effort, and the overall explanation across a single line in the portlet.
 -
 Have you considered using Rally in conjunction with Clarity? Have you seen or heard about the OOTB connector? This class will go through the OOTB connector in detail and show how Rego has built our ad-on to enhance the connectivity between these two tools.
 -
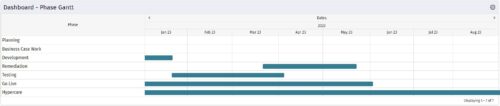 The Dashboard: Phase Gantt portlet gives an overview of all WBS level 1 tasks or milestones for a single project. The portlet will pull the "id" from the page it is placed on, so this portlet is usually placed on the project dashboard tab. The portlet displays the name, and a graphical representation of the timeline for the phases. The date range may be configured by day, month, year, or quarter. The start date may also be configured to any date or a relative date (start of current month, start of next year, etc).


Copyright 2023 • Rego Consulting Corporation • Privacy Policy