-
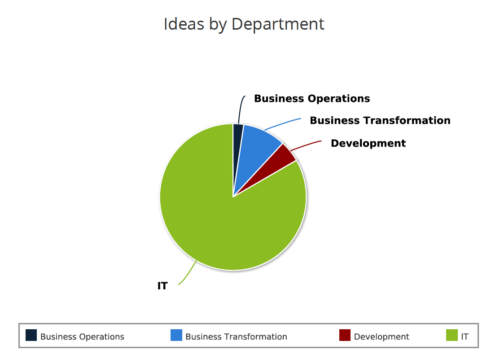 Ideas by Department report is a pie chart that displays count of ideas by department. Mouse over on the pie chart displays idea count for that department. You can further narrow your search by OBS Type & Path , Idea Status, Idea Start Date and Is Idea Active?.
 -
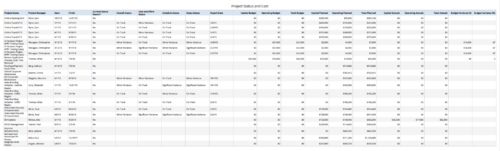 Project Status and Costs report gives the Project Manager a single place to view various Project Statuses ( Cost and Effort, Schedule, Scope and Overall ) and Costs ( Planned, Budget & Actuals ) for multiple projects. User can further narrow their search by OBS Type & Path, Project Name, Project Manager and Is Project Active?.
 -
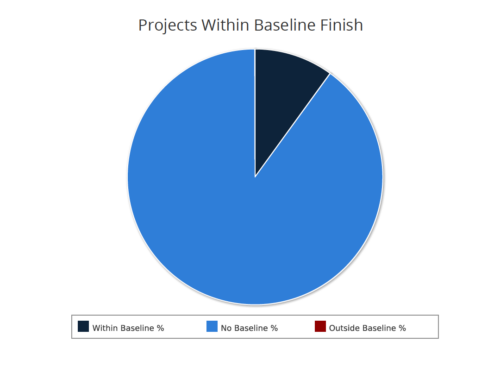 Projects within baseline finish report is a pie chart that displays projects that have a baseline or do not have a baseline. Projects with baseline are further segregated into within or outside baseline finish. Mouse over on the pie chart displays the % of projects within a particular category. You can further narrow your search by OBS Type & Path, Project Finish Date and Is Project Active?.
 -
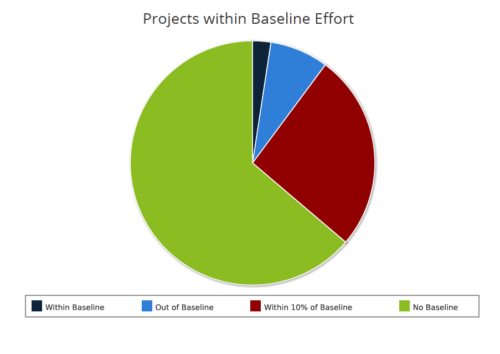 Projects within baseline effort report is a pie chart that displays projects baseline effort by their categories. Legend displays various baseline effort categories: Within Baseline, Out of Baseline, Within 10% Baseline and No Baseline. Mouse over on the pie chart displays the total number of projects within that particular category. You can further narrow your search by OBS Type & Path and Is Project Active?.
 -
 The Financial Summary by Transaction Class provides a visual graph for each year’s financial picture for multiple years. Report contains the following items: KPIs: Displays total benefit, capital, expense and net cash flow for the selected filter criteria Grid: Displays year wise break up of benefit, capital, expense and net cash flow for the selected filter criteria Graph: Benefit, capital, expense and net cash flow are depicted in graphical way for multiple years. This report will show the user where they need to concentrate their efforts in order to meet financial commitments. User can further narrow their search by OBS Type & Path.
 -
 Do you want to improve the success of your CA PPM projects? This class will discuss some lessons learned on making CA PPM projects more successful. We will discuss things like
- developing robust test plans, creating effective use and test cases, and implementing test scripts that make sense.
- why failures occur, and what you can do to minimize the impact and plan for success: case study in lessons learned.
- developing, testing, fine tuning, and executing deployment plans for success.
-
 Does project and idea estimation take too long and lack visibility? This class will address one of the most common pain points within organizations: how to involve the right people within a timely project estimate. Learn Rego’s model for defining, calculating, and modifying idea and project estimates, so you can increase throughput and ROI.
 -
 Are you struggling with implementing Agile tools in your organization in addition to CA PPM? This class will review best practices for implementing agile tools in conjunction with CA PPM - living in a Bi-Modal world. We will discuss how CA PPM can be used to govern both types of work and teams and how Agile tools should interface into CA PPM.
 -
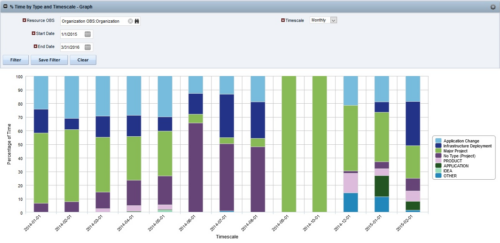
 The Percent Time by Type and Timescale - Graph portlet shows a breakout of time by timescale for resources the logged in user has view rights to. This portlet gives the Clarity user the ability to show the amount of hours spent on each project type by week, month, quarter and year. Using this portlet, the Clarity user can get an overview of all hours in a time period or use the filter to search for a specific dataset (as required). The portlet provides a filter for OBS and date ranges.
 -


The Percent Time by Type and Timescale - Grid portlet shows a breakout of time by timescale for resources the logged in user has view rights for using the timeslices. This portlet gives the Clarity user the ability to show the amount of hours spent on a project by week, month, quarter and year. Using this portlet, the Clarity user can get an overview of all hours in a time period or use the filter to search for a specific dataset (as required). The portlet provides a filter for OBS and date ranges. -
The Percent Time by Type and Timescale - Grid portlet shows a breakout of time by timescale for resources the logged in user has view rights for using the timeslices. This portlet gives the Clarity user the ability to show the amount of hours spent on a project by week, month, quarter and year. Using this portlet, the Clarity user can get an overview of all hours in a time period or use the filter to search for a specific dataset (as required). The portlet provides a filter for OBS and date ranges. -
The Percent Time by Type and Timescale - Grid portlet shows a breakout of time by timescale for resources the logged in user has view rights for using the timeslices. This portlet gives the Clarity user the ability to show the amount of hours spent on a project by week, month, quarter and year. Using this portlet, the Clarity user can get an overview of all hours in a time period or use the filter to search for a specific dataset (as required). The portlet provides a filter for OBS and date ranges. -

 Pie Chart displays projects by Baseline Finish Variance—is current project finish beyond baseline finish; or is current project finish on or before baseline finish. Filterable by OBS structure and Finish Date range. Data labels show percent within baseline vs percent outside baseline. Mouse-over shows Within or Outside label and percent of total projects. Legend shows color coded Within Baseline and Outside Baseline labels. Drilldown: Clicking on a pie slice yields a grid portlet of projects either Within or Outside Baseline.
 -
Pie Chart displays projects by Baseline Finish Variance—is current project finish beyond baseline finish; or is current project finish on or before baseline finish. Filterable by OBS structure and Finish Date range. Data labels show percent within baseline vs percent outside baseline. Mouse-over shows Within or Outside label and percent of total projects. Legend shows color coded Within Baseline and Outside Baseline labels. Drilldown: Clicking on a pie slice yields a grid portlet of projects either Within or Outside Baseline.
-
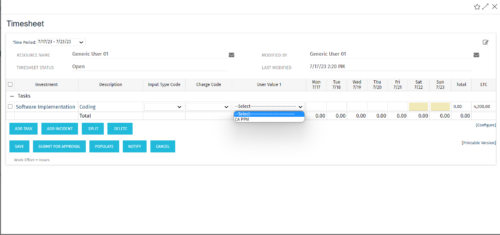 The tech-trick shows how to retrieve logged in User related values (ex: skill set) in timesheet.
 -
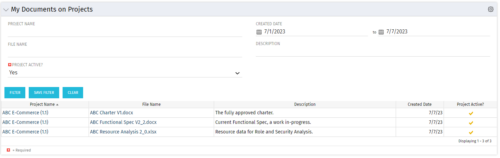 This Portlet allows users to quickly access Documents they uploaded into Projects via the Classic UI à Collaboration tab or via the New UX Documents module. Clicking on the File Name downloads the file, clicking on the Options gear allows users to export the list to Excel.
 -
 A Quick Reference Guide that reviews access to Project Tasks and Task To Dos in Clarity PPM’s Modern UX.
 -
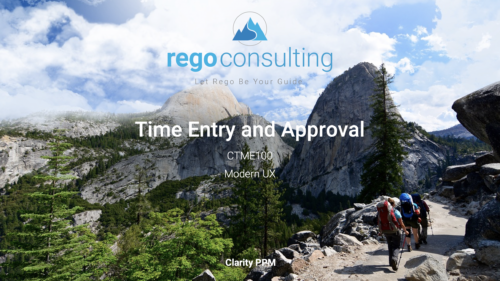 A slide deck that reviews the processes for time entry and approval of timesheets in Clarity’s Modern UX. Used for Rego’s training engagements, it covers the Time Entry process via flow chart, steps for submitting a timesheet, adjusting a returned timesheet, and adding or removing tasks from a timesheet.
 -
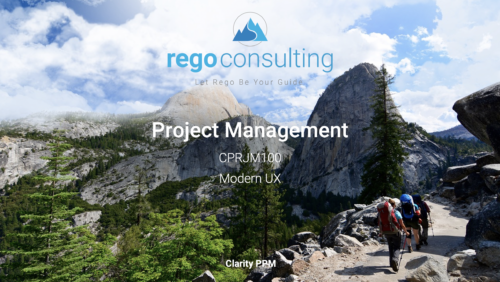 A slide deck used in Rego’s training classed for Project Management in the Modern User Experience. Reviews terms and definitions, the OBS, Work Breakdown Structure, Templates, Roles and Responsibilities, Allocation vs ETC, Accessing Projects, Project Creation, Staffing, Tasks, Assignments, To Dos, Project Financials, and more.
 -
 A Quick Reference Guide to assist in the population of the Project Property Details. Reviews accessing and updating the project property details. Also shows alternative in-line edits.
 -
 A Quick Reference Guide that covers how to staff a Team in Clarity’s Modern UX. It reviewes some of the key terminology, covers Allocation vs. ETC, accessing the Staffing Tab, and viewing time-scaled allocations.
 -
 A Quick Reference Guide to assist in managing project task in Clarity’s Modern UX via the Task List Tab. Provides a quick review of WBS, accessing the Task List Tab, the associate Sub Tabs, task level conversations, Task To Do’s, Task Assignments, and Task Properties.


Copyright 2023 • Rego Consulting Corporation • Privacy Policy