-
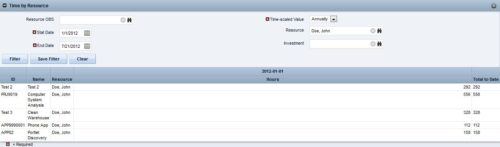
 This portlet displays the actual hours resources entered against investments. The per-period actual hours can be showed in days, weeks, months, quarters, or years. The data can be filtered by Resource, Resource Manager, OBS Unit, Investment and time period
 -
This portlet displays the actual hours resources entered against investments. The per-period actual hours can be showed in days, weeks, months, quarters, or years. The data can be filtered by Resource, Resource Manager, OBS Unit, Investment and time period
-
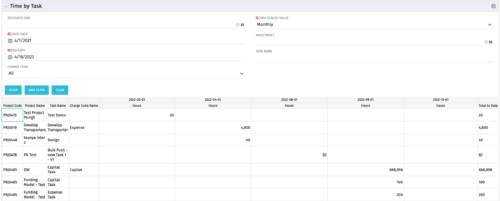 The Time by Task portlet displays time logged to tasks for all investments the logged in user has security rights to view - pulling data from the timeslices. It is capable of displaying the data by weekly, monthly, quarterly or annually segments. The portlet may also be filtered by investment and resource OBS.
 -
 The Auto-Approve Old Timesheets workflow process can be run through the "Execute a Process" job and may be used to quickly close out timesheets for a specified timeframe for period closure. The workflow will execute a query that will automatically approve ALL (no matter the status of the timesheet) timesheets that have a time period start date before the Approve Date specified within the process itself.
 -
 The Rego: Transfer Primary Skill process updates the primary skill on the team object by running the process with the execute process job. The process takes the primary skill that is on the resource object and moves it to all of that resource's team records where the primary skill on the team record is null. Utilizing these fields and process provide a quick way to determine what skill each resource is bringing to the project. This process makes the transition seamless from resource primary skill to team primary skill.
 -
The Rego: Transfer Primary Skill process updates the primary skill on the team object by running the process with the execute process job. The process takes the primary skill that is on the resource object and moves it to all of that resource's team records where the primary skill on the team record is null. Utilizing these fields and process provide a quick way to determine what skill each resource is bringing to the project. This process makes the transition seamless from resource primary skill to team primary skill.
-
 A presentation slide deck from Rego University 2022. This document reviews the principles of Scaled Agile Framework.
- Understanding Agile, Scrum, and Kanban
- The Limits of Team Agile
- Scaling Agile
-
 A presentation slide deck from Rego University 2022. Broadcom’s presentation on organizing an Agile Enterprise.
- Prepare your renovation plan
- Assess and update your systems
- Finish the interior
- Finish the exterior (and preparing for bad weather)
- Final inspection
-
 This training document is a Rego Consulting Quick Reference Guide to assist with the utilization of the My Workspace area within Clarity’s Modern User Experience. This doc references version 16.1 views. Document reviews Checklists, Smartlists and To Do’s.
 -
 This training document is a Rego Consulting Quick Reference Guide to assist with Project creations in Clarity’s Modern User Experience. This doc references version 16.1 views. Doc covers create project from project page, create project via the New from Template button, selection of template and project creation from the project tile view.
 -
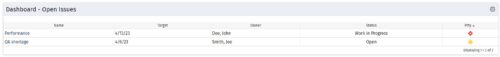 The Dashboard: Open Issues portlet gives an overview of all issues that are not closed or resolved for a single project. The portlet will pull the "id" from the page it is placed on, so this portlet is usually placed on the project dashboard tab. The portlet sorts the issues first by priority and then by target date. It displays the name, target date, owner, status and priority.
 -
 The Dashboard: Open Milestones portlet gives an overview of all milestones that are started or not started for a single project. The portlet will pull the "id" from the page it is placed on, so this portlet is usually placed on the project dashboard tab. The milestones are sorted by Due Date. It displays the name, Due Date, Baseline Date, Days Late (Due Date – Baseline Date), and Days Old (Current Date – Due Date).


Copyright 2023 • Rego Consulting Corporation • Privacy Policy