-
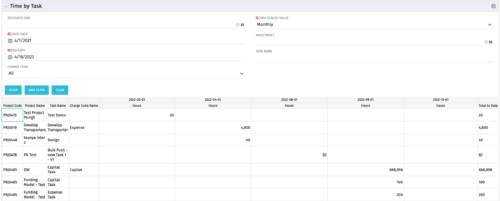 The Time by Task portlet displays time logged to tasks for all investments the logged in user has security rights to view - pulling data from the timeslices. It is capable of displaying the data by weekly, monthly, quarterly or annually segments. The portlet may also be filtered by investment and resource OBS.
 -
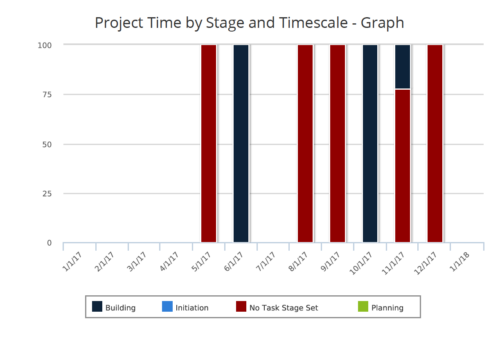 Time by Stage and Timescale – Graph report is a stacked column chart that displays hours for all tasks on projects by their stage for a user-defined time period. Using this report, Management can determine if excess time is being spent on a certain task stage within a project You can further narrow your search by Month Start Date, OBS Type & Path, Is Project Active? And Is Template?
 -
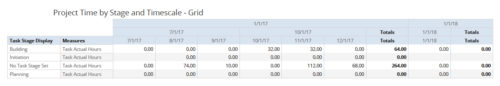 Time by Stage and Timescale – Grid report displays hours for all tasks on projects by their stage for a user-defined time period. Information can be drilled down to Year, Quarter or Monthly level. Using this report, Management can determine if excess time is being spent on a certain task stage within a project You can further narrow your search by Month Start Date, OBS Type & Path, Is Project Active? And Is Template?
 -
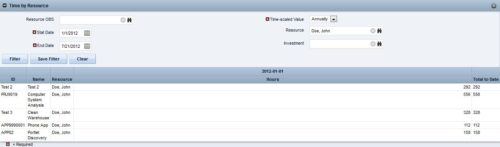
 This portlet displays the actual hours resources entered against investments. The per-period actual hours can be showed in days, weeks, months, quarters, or years. The data can be filtered by Resource, Resource Manager, OBS Unit, Investment and time period
 -
This portlet displays the actual hours resources entered against investments. The per-period actual hours can be showed in days, weeks, months, quarters, or years. The data can be filtered by Resource, Resource Manager, OBS Unit, Investment and time period
-
This portlet displays the actual hours resources entered against investments. The per-period actual hours can be showed in days, weeks, months, quarters, or years. The data can be filtered by Resource, Resource Manager, OBS Unit, Investment and time period
-
 This portlet displays Actual Time by Project over a span of time. It supports Annual, Quarterly, Monthly, and Weekly time periods. The time span displayed is controlled by a filter field for the Start Date (of the time span) and by a filter field for the Number of Time Periods to be displayed. There are also filters for Project name, Project Manager, and Project Type.
 -
This portlet displays Actual Time by Project over a span of time. It supports Annual, Quarterly, Monthly, and Weekly time periods. The time span displayed is controlled by a filter field for the Start Date (of the time span) and by a filter field for the Number of Time Periods to be displayed. There are also filters for Project name, Project Manager, and Project Type.
-
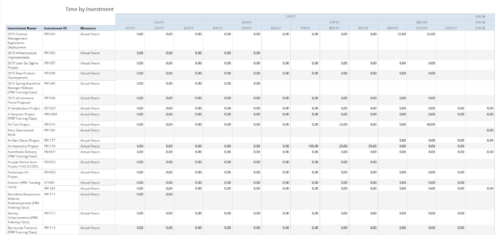 Time by Investment report displays time spent by resources on investment(s). User can view only the investments that he has access to view. Information can be drilled to Yearly, Quarterly or Monthly level. User can further narrow their search by OBS Type & Path, Investment Name, Month Start Date and Is Project Active?.
 -
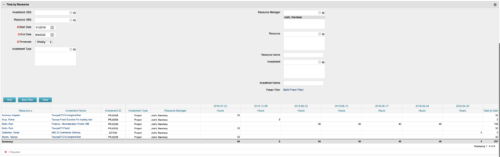
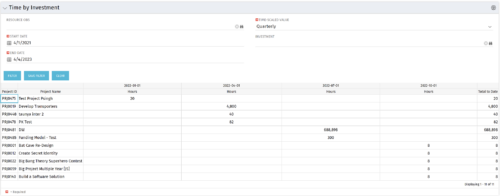
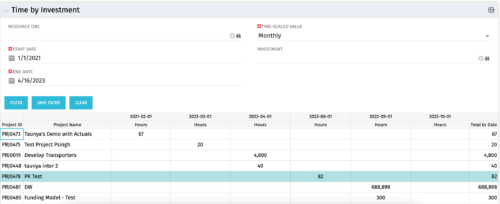 The Time by Investment portlet displays time logged to investments for all investments the logged in user has security rights to view using data from timeslices. It is capable of displaying the data by annual, quarterly, monthly, weekly, and daily segments with totals per date also being presented. The portlet may can be filtered by investment, resource OBS, and time segments. This portlet can be used as a management and governance tool to review aggregate hours posted to investments by time period.
 -
The Time by Investment portlet displays time logged to investments for all investments the logged in user has security rights to view using data from timeslices. It is capable of displaying the data by annual, quarterly, monthly, weekly, and daily segments with totals per date also being presented. The portlet may can be filtered by investment, resource OBS, and time segments. This portlet can be used as a management and governance tool to review aggregate hours posted to investments by time period.
-
 The Time by Investment portlet displays time logged to investments for all investments the logged in user has security rights to view using data from timeslices. It is capable of displaying the data by annual, quarterly, monthly, weekly, and daily segments with totals per date also being presented. The portlet may can be filtered by investment, resource OBS, and time segments. This portlet can be used as a management and governance tool to review aggregate hours posted to investments by time period.
 -
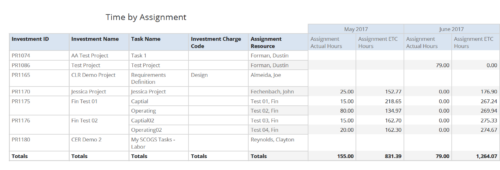 Time by Assignment report displays time logged to assignments and its associated actuals on monthly basis for all filtered investments. It also displays total ETC and Actual hours associated with an assignment. User can further narrow their search by OBS Type & Path, Investment Type, Investment Charge Code, Investment Name, Task Name, Resource Name, Assignment Start Date and Assignment Finish Date. User can use exact dates or relative dates for Assignment Start and Finish Dates filter parameters.
 -
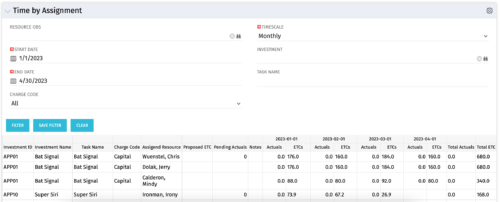 The Time by Assignment portlet displays time logged to assignments for all investments the logged in user has security rights to view - pulling data from the timeslices. It is capable of displaying the data by weekly, monthly or quarterly segments. The portlet may also be filtered by investment and resource OBS.
 -
The Time by Assignment portlet displays time logged to assignments for all investments the logged in user has security rights to view - pulling data from the timeslices. It is capable of displaying the data by weekly, monthly or quarterly segments. The portlet may also be filtered by investment and resource OBS.
-
 The hit TV series Ted Lasso is well known for its humor and entertainment value, but hidden under the light-hearted banter are some important messages that leaders can take to heart. Join expert Agile guide, Tad Beaty, for a review of the first two seasons of the show. We’ll explore the messages that all leaders should take back to the office to improve engagement and make a better workplace.
 -
 To effectively practice Agile at scale, Clarity teams first need to identify various needs. This includes thinking through considerations for funding, investment prioritization, and spend management practices.
 -
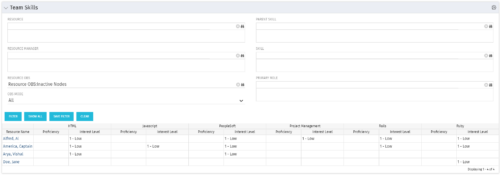 The Team Skills portlet displays Skill Proficiency and Interest Level by Resource. Users can utilize this view to search for Resources by Skill, Parent Skill, Interest, Role, Parent Role, Resource and Resource OBS. This portlet grants a Project Manager or Resource Manager the ability to determine which Resources best fit the needs for their project.
 -
The Team Skills portlet displays Skill Proficiency and Interest Level by Resource. Users can utilize this view to search for Resources by Skill, Parent Skill, Interest, Role, Parent Role, Resource and Resource OBS. This portlet grants a Project Manager or Resource Manager the ability to determine which Resources best fit the needs for their project.
-
 A Quick Reference Guide that covers task assignments in Clarity’s Modern UX. The guide reviews the Assignment Tab and updating ETC via two options.
 -
 A Quick Reference Guide that reviews access to Project Tasks and Task To Dos in Clarity PPM’s Modern UX.
 -
 This training document is a Rego Consulting Quick Reference Guide to assist with Task management under the Task Tab in Clarity’s Modern User Experience. Document reviews the three task views available: Timeline view, Board view and Grid view.
 -
 This training document is a Rego Consulting Quick Reference Guide to assist with use of the Task List Tab to manage project tasks in Clarity’s Modern User Experience. Document reviews the Task List Tab, and the Task Tab Sub Tabs.
 -
 When a task is marked as complete the process looks to any tasks that are dependent on the newly completed task. If a task is marked as “Not Started” and all of the dependency tasks are marked as complete then the process will change the task status to “Started” and email all resources that are assigned to the task that has started. The process notifies resources that a task is ready to start and saves the project manager the manual effort of updating dependent tasks. NOTE: The process relies on task dependencies and is most useful in those environments where task dependencies are managed.
 -
When a task is marked as complete the process looks to any tasks that are dependent on the newly completed task. If a task is marked as “Not Started” and all of the dependency tasks are marked as complete then the process will change the task status to “Started” and email all resources that are assigned to the task that has started. The process notifies resources that a task is ready to start and saves the project manager the manual effort of updating dependent tasks. NOTE: The process relies on task dependencies and is most useful in those environments where task dependencies are managed.
-
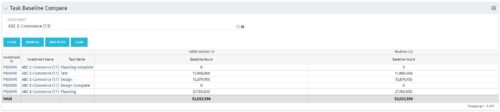 The Task Baseline Compare portlet displays the tasks in a specific Investment and provides the ability to compare the baseline hours for the tasks in each version of the baseline.
 -
The Task Baseline Compare portlet displays the tasks in a specific Investment and provides the ability to compare the baseline hours for the tasks in each version of the baseline.
-
The Task Baseline Compare portlet displays the tasks in a specific Investment and provides the ability to compare the baseline hours for the tasks in each version of the baseline.
-
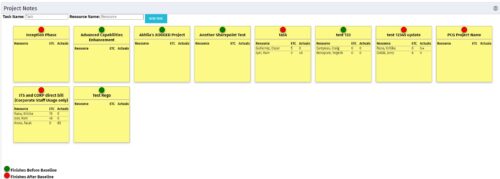 The Task-At-A-Glance Notes portlet provides a view of project tasks and assignments in an easy to read format, similar to popular sticky – note applications. This portlet will display all tasks on a project, ‘pinning’ them to a dashboard. Each task will include the resources assigned to them, as well as the ETCs left for the resource, and the actuals that they have posted. Each sticky note allows you to link to the task details, as well as the resource assignment details. In addition to important assignment detail, each pin on the individual task’s note indicates if the task finishes before the baseline (green), or if it is going to finish after the baseline (red).
 -
The Task-At-A-Glance Notes portlet provides a view of project tasks and assignments in an easy to read format, similar to popular sticky – note applications. This portlet will display all tasks on a project, ‘pinning’ them to a dashboard. Each task will include the resources assigned to them, as well as the ETCs left for the resource, and the actuals that they have posted. Each sticky note allows you to link to the task details, as well as the resource assignment details. In addition to important assignment detail, each pin on the individual task’s note indicates if the task finishes before the baseline (green), or if it is going to finish after the baseline (red).
-
 A Quick Reference Guide to assist with Task Assignments in Clarity. The document shows screen shots from the Classic UX with the Phoenix theme.
 -
 This training document is a Rego Consulting Quick Reference Guide to assist with managing Task Assignments in Clarity’s Modern User Experience. The document covers creating new assignments and updating ETC.


Copyright 2023 • Rego Consulting Corporation • Privacy Policy