-
 Course description: “Are you struggling with decision making processes? This session will show you the ins and outs of how a good governance framework provides the foundation for better project decisions to help achieve goals and finish on time and within budget.” Download file is the presentation slide deck.
 -
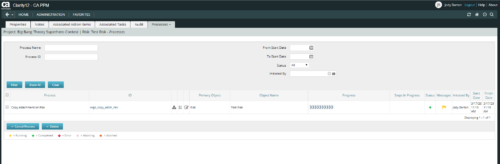 This is workflow that allows you to copy documents from one item to another. This can be altered to move documents from any place they are stored to another. In this particular instance, the focus is on moving documents from one risk to another. When creating a risk that you want to copy from, utilize the attachments section of the page and the associated lookup. The lookup is filtered to only show those risks that already have documents associated with them. Upon clicking the save button, a process runs in the background to copy the requested documents from the requested risk to this newly created risk.
 -
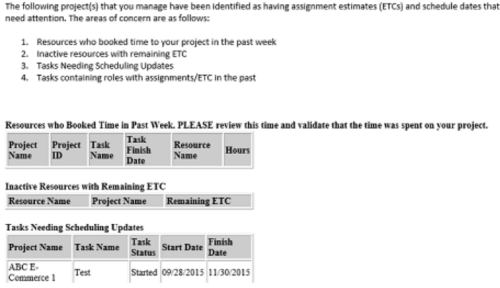 “PM Stalker – Project Validations & Issues” executes various queries against the Clarity database and sends an email to all PMs who have one or more projects with any of the following conditions:
- Resources have booked time in the past week (validation needed)
- Inactive Resources with ETCs still on the project
- Tasks past their Finish Date but not completed
- Task Role Assignments in the past
-
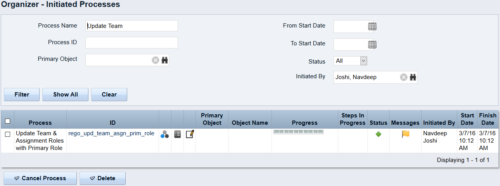 This process updates the team, assignment and timesheet roles with the primary role where they do not match. This way, the PM can push all roles to team and assignment for that project before they do a cost plan.
 -
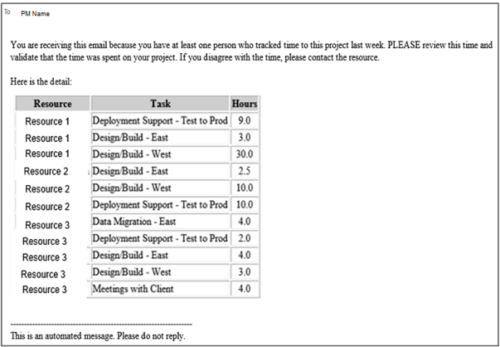 This process pulls in the total hours tracked, by resource, by task, for a given project for the weekly time period that ended. The information is sent to the Project Manager listed on the project. This process can be scheduled via the Execute a Process job.
 -
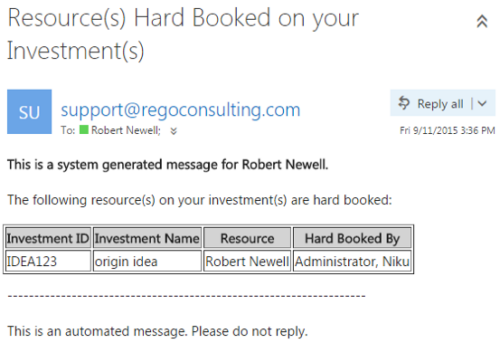 This notification process sends an email to the Manager of an investment (Project, Application, Idea, etc) when the resource assigned to the team has been hard booked. The process should be scheduled to run on a daily basis as the logic in it looks to all resources where their Booking Status has been changed from Soft to Hard on the day that the process is run. It compares the audit trail date change field to the system date. If the process is not scheduled to run daily no notification will occur on hardbookings from previous days.
 -
 When a task is marked as complete the process looks to any tasks that are dependent on the newly completed task. If a task is marked as “Not Started” and all of the dependency tasks are marked as complete then the process will change the task status to “Started” and email all resources that are assigned to the task that has started. The process notifies resources that a task is ready to start and saves the project manager the manual effort of updating dependent tasks. NOTE: The process relies on task dependencies and is most useful in those environments where task dependencies are managed.
 -
When a task is marked as complete the process looks to any tasks that are dependent on the newly completed task. If a task is marked as “Not Started” and all of the dependency tasks are marked as complete then the process will change the task status to “Started” and email all resources that are assigned to the task that has started. The process notifies resources that a task is ready to start and saves the project manager the manual effort of updating dependent tasks. NOTE: The process relies on task dependencies and is most useful in those environments where task dependencies are managed.
-
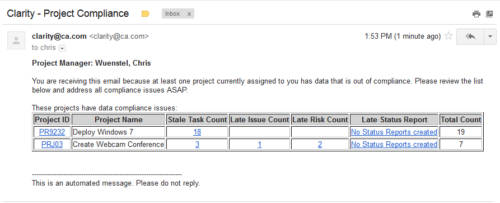 The Project Compliance Stalker – PM sends an email to Project Managers (and also their managers if so desired) at a set interval to alert them to project compliance issues. Areas of compliance that are reviewed include: stale project tasks (stale = past due date), late issues and risks (past due date) and late status reports.
 -
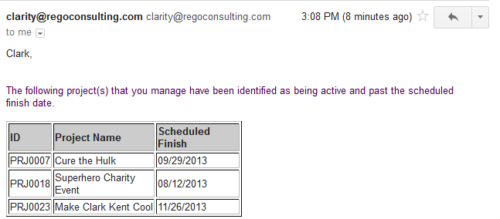 Based on the pre-determined schedule frequency, this job will send an email to Project Managers that have a project meeting the criteria of: project(s) are active and scheduled finish date is less than the current date. This serves as a reminder to Project Managers to keep their schedules true. The contents of the email include a message indicating the project manager has at least one project meeting this criteria and a table indicating the Project ID, Project Name and Scheduled Finish Date.
 -
 The Grant Team Project Edit Rights workflow allows a project manager to grant Project – Edit Management rights to all users staffed on the project. This workflow saves not only the project manager time by allowing all users on the project to update information, but also saves the administrator time from granting each resource these rights individually. The process will also remove any rights from members that have been removed from the project.
 -
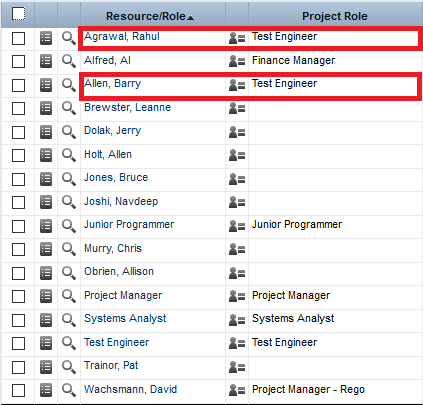
 The Move Role to Team/Assignment process takes the role from the resource object and pushes that information into the team and assignment objects when the role is NULL on the team and assignment objects. This happens normally, assuming a resource has their primary role populated. This process is needed if a resource or set of resources were added to projects without having their primary role filled in.
 -
The Move Role to Team/Assignment process takes the role from the resource object and pushes that information into the team and assignment objects when the role is NULL on the team and assignment objects. This happens normally, assuming a resource has their primary role populated. This process is needed if a resource or set of resources were added to projects without having their primary role filled in.
-
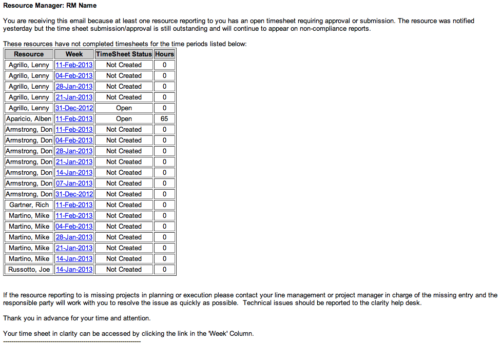 The Time Tracking Stalker - RM workflow process automatically sends an email to Resource Managers for each one of their resources that have not submitted their timesheet for a prior open time period, thus informing the RM if their resources are submitting their timesheets on time. Project Managers will also benefit since the notifications will help to ensure that time is being posted against their projects in a timely manner, helping to provide them with an accurate view of time expended on the projects.
 -
 The PM Stalker – Submit Status Report workflow process will email any project manager that has not submitted a status report in the last two weeks. This process will ensure that all status reports are kept up-to-date and provide management with a reliable overview of the status on the project.
 -
 The Grant Project Edit Rights workflow process allows a project manager to grant project edit rights to another user without contacting an administrator. The workflow uses the Out-of-the-box field for Business Owner. The script starts when the field is updated. It will assign project edit rights to whichever user is added to the Business Owner field. This process can be modified to grant project edit rights to any user within a project field.
 -
 The Convert Incident to Task workflow process allows users to quickly create tasks from incidents without the need to input the information twice. It utilizes a newly added checkbox and project fields on the incident object. The user will need to select the project that he or she wants the task added to using the “Project” field on the incident object. Next, the “Convert to Task” checkbox will kick off the process. Once ticked, the process will perform the necessary actions to create a task on the specified project.
 -
The Convert Incident to Task workflow process allows users to quickly create tasks from incidents without the need to input the information twice. It utilizes a newly added checkbox and project fields on the incident object. The user will need to select the project that he or she wants the task added to using the “Project” field on the incident object. Next, the “Convert to Task” checkbox will kick off the process. Once ticked, the process will perform the necessary actions to create a task on the specified project.
-
 The Re-Baseline via Change Request process is a simple method for a member of the project (who has the ability to create change requests) to request a re-baseline of the project without the project manager having to perform it. First, the user must create the change request. The user must then start the process within the change request by using the Processes tab. Once started, the process will route an action item to the Project Manager. If rejected, the process will end and the user must start it again (if needed). If approved, the process will then baseline the project and close out the change request.
 -
 Course Description: Does your organization own Workfront in a marketing or other group doing digital asset management? In this session, we will dive into what Workfront is and how it complements your current Clarity PPM solution.
 -
 Course Description: Do you want to talk to other customers that are using or plan to use project management? In this moderated round table, customers can share experiences and provide insights on process, configurations, challenges, and successes. We will divide into small groups and discuss customer selected topics—100% sharing
 -
 Course Description: Do you want to improve the success of your projects? This class will discuss some lessons learned on making projects more successful. We will discuss things like: • Developing robust test plans, creating effective use and test cases, and implementing test scripts that make sense.
- Why failures occur and what you can do to minimize the impact and plan for success—including a case study on lessons learned.
- Developing, testing, fine-tuning, and executing deployment plans for success.
-
 Course Description: How mature is your PMO? Where do you go from here? This class is a working session, which includes an exercise to assess how far you’ve come and help direct your course.
 -
 Course Description: In the new bimodal IT environment, does your organization lack insights into what Agile work is being done and what value is being delivered? Learn how Apptio Agile Insights merges data from multiple Agile tools, including Clarity PPM, to bring together a total picture of the value IT is delivering.
 -
 PMOs/EPMOs are feeling some pressure from Agile disruptors in their organizations. Some Agile purists insist that they can do everything with an Agile tool and no PMO governance, but this really isn’t the case. If you belong to a PMO or EPMO, this session will help you to better collaborate with your Agile counterparts in finding better and more holistic solutions to value delivery. Tips on how to use Agile principles in your talking points will also be shared.
 -
 Broadcom’s Laureen Knudsen and Noël Rodriguez discuss the current and evolving state of the PMO.
 -
 This portlet displays the % allocation of resources to projects. The portlet shows if the resource is allocated to the projects as an individual resource or as part of an Agile team, in which case it will display the resource % allocation to the team and what that will represent in terms of % allocation to the project. The Total Allocation % display the allocation of the resource to all investments is allocated to. Remaining Capacity and Over/Under columns will help identify the resources that still have availability and the ones that are over allocated.
 -
 The Timesheet Notes portlet displays all timesheet notes split out by resource, investment and task. This is very useful in situations where you want to review multiple notes as you do not have to open each note separately. The table below describes the available filter fields in the portlet.
Column Label Description Timesheet Period Start Range of time periods to display filtered by start date Timesheet Period Finish Range of time periods to display filtered by finish date Resource Resource(s) to display Type Note on a timesheet or time entry (task specific) -
The Timesheet Notes portlet displays all timesheet notes split out by resource, investment and task. This is very useful in situations where you want to review multiple notes as you do not have to open each note separately. The table below describes the available filter fields in the portlet.
Column Label Description Timesheet Period Start Range of time periods to display filtered by start date Timesheet Period Finish Range of time periods to display filtered by finish date Resource Resource(s) to display Type Note on a timesheet or time entry (task specific) -

This portlet displays the monthly allocation per resource. The PM can view by the RM or the resource to get the data for monthly resource allocations. The table below describes the available filter fields in the portlet. Column Label Description Work Effort Manager Manager of the Investment the Work Effort is on Work Effort Active Active status of the Investment the Work Effort is on Resource Resource’s Name Internal Resource ID Resource’s ID Zero Allocation Show Allocations that equal zero Open for Time Entry Is the Resource Open for Time Entry Resource Active Resource’s Active status Role Resource’s Primary Role OBS Unit Resource’s OBS Start Allocation Start Time to filter by End Allocation Finish time to filter by -
 This is a graphic portlet that pulls the average schedule variance by OBS node of the project. The portlet allows you to choose any OBS that is associated to the Project Object. Users can filter by:
- OBS Type
- If the project is financially approved?
- Financial Status
-
This is a graphic portlet that pulls the average schedule variance by OBS node of the project. The portlet allows you to choose any OBS that is associated to the Project Object. Users can filter by:
- OBS Type
- If the project is financially approved?
- Financial Status
-
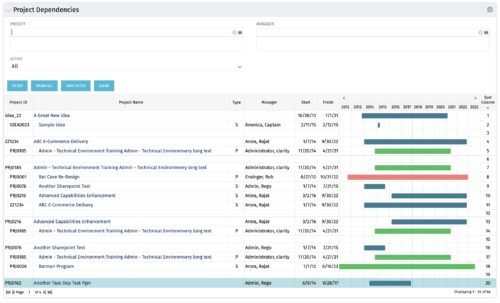
The Project Dependencies portlet displays all projects and their associated dependencies that the logged in user has rights to. This can assist in scheduling and visualizing the breakout of dependencies. The table below describes the available columns in the portlet. Column Label Description Project ID ID of the project Project Name Name of the project Type Relationship to above project, Parent Project (P) or Sub Project (S) Manager Manager of the project Start Start Date of the project Finish Finish Date of the project Gantt Visualization of project timelines Sort Column Used to order the columns for proper display of the portlet dimkey Internal code used by the query Inv_hlth_int Internal code used by the query Link_dbid Internal code used by the query link_toggle Internal code used by the query rel_active Internal code used by the query rel_dbid Internal code used by the query rel_mgr_dbid Internal code used by the query rel_sort Internal code used by the query -
The Project Dependencies portlet displays all projects and their associated dependencies that the logged in user has rights to. This can assist in scheduling and visualizing the breakout of dependencies. The table below describes the available columns in the portlet. Column Label Description Project ID ID of the project Project Name Name of the project Type Relationship to above project, Parent Project (P) or Sub Project (S) Manager Manager of the project Start Start Date of the project Finish Finish Date of the project Gantt Visualization of project timelines Sort Column Used to order the columns for proper display of the portlet dimkey Internal code used by the query Inv_hlth_int Internal code used by the query Link_dbid Internal code used by the query link_toggle Internal code used by the query rel_active Internal code used by the query rel_dbid Internal code used by the query rel_mgr_dbid Internal code used by the query rel_sort Internal code used by the query -
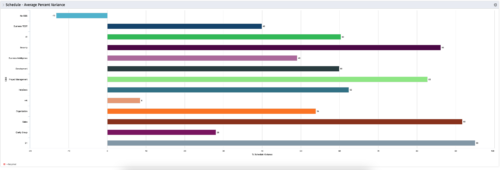
 Bar Chart displays average percent variance for all active projects by OBS unit. Percent variance = Planned Cost - Budgeted Cost / Budgeted Cost * 100. Projects with no Budgeted Cost are ignored for the calculation. Then all project variance percentages are algebraically added (some may be negative), and divided by total projects with a variance. This yields the Average Percent Variance. This calculation is performed for active projects in each OBS unit. OBS units include all units at all levels where projects are attached. Portlet filterable by OBS, Financial Status, and Financially Approved. Vertical axis = OBS Unit Name. Horizontal axis = Variance Percent. Data value = Average Percent Variance. Mouseover value = OBS Name + Average Variance Percent.


Copyright 2023 • Rego Consulting Corporation • Privacy Policy