-
 Are you starting a project/financial management implementation, or do you want to compare how you are using these functions vs. others or best practices? In this class we will discuss some best practices from successful customers.
 -
 Agile is here to stay, but waterfall may be as well. Companies around the world struggle with living in a bimodal development world, while trying to go through an agile transformation. This session will discuss best practices and lessons learned within companies that have gone through agile transformations. We will also review SAFe as a potential approach.
 -
 No matter how hard we try, many organizations cannot pry Excel out of the hands of project and resource managers. In this class we will explore possibilities that give up the battle and embrace Excel as a great data entry tool. We will show some neat case studies on quick Excel integrations deployed at customers.
 -
 The Timesheet Notes portlet displays all timesheet notes split out by resource, investment and task. This is very useful in situations where you want to review multiple notes as you do not have to open each note separately. The table below describes the available filter fields in the portlet.
Column Label Description Timesheet Period Start Range of time periods to display filtered by start date Timesheet Period Finish Range of time periods to display filtered by finish date Resource Resource(s) to display Type Note on a timesheet or time entry (task specific) -
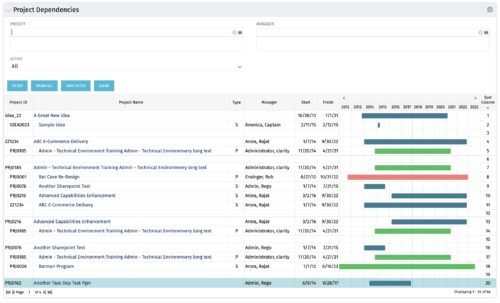
The Project Dependencies portlet displays all projects and their associated dependencies that the logged in user has rights to. This can assist in scheduling and visualizing the breakout of dependencies. The table below describes the available columns in the portlet. Column Label Description Project ID ID of the project Project Name Name of the project Type Relationship to above project, Parent Project (P) or Sub Project (S) Manager Manager of the project Start Start Date of the project Finish Finish Date of the project Gantt Visualization of project timelines Sort Column Used to order the columns for proper display of the portlet dimkey Internal code used by the query Inv_hlth_int Internal code used by the query Link_dbid Internal code used by the query link_toggle Internal code used by the query rel_active Internal code used by the query rel_dbid Internal code used by the query rel_mgr_dbid Internal code used by the query rel_sort Internal code used by the query -
 Pie Chart Portlet displays counts of active projects with various Stale ratings. Calculation is Percent Stale Tasks = number of open (not completed) tasks with a finish date over 15 days old, divided by total open tasks. Filterable by OBS structure and project manager. Data label = project count. Mouse-over and Legend labels = stale rating. More than 90% Stale means 90 to 100% of open tasks on a project have finish dates older than 15 days. More than 71% Stale means 71 to 89% of open tasks on a project have finish dates older than 15 days. 0 - 70% Stale means fewer than 70% of open tasks on a project have finish dates older than 15 days.
 -
 Funnel Chart displays aggregated counts of Ideas by “Idea Progress”, a custom attribute. Chart shows Idea Progress names in legend, and count total is available as a mouse-over. No filters available on this portlet.
 -
 This portlet will allow administrators or other managers to see what resources have been granted instance rights to any investment. Filtering is available by resource, investment or right.
 -
This portlet will allow administrators or other managers to see what resources have been granted instance rights to any investment. Filtering is available by resource, investment or right.
-
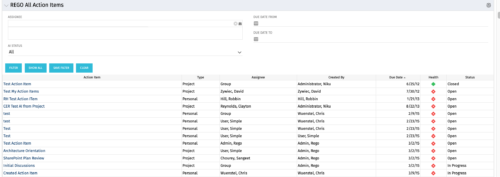 The All Action Items portlet provides detail on all actions items, including the name, type, assignee, status, due date, health indicator and creator of the action item. The portlet can be filtered by project, assignee, AI status, and due date range.
 -
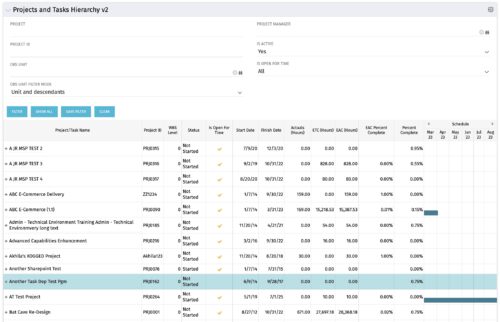 Grid Portlet displays project and task data--including name, dates, status, effort, %Complete, and schedule. Portlet initially displays project data. But there is a + sign toggle, which, when clicked, reveals task data, and the toggle becomes a – sign. User can choose to Automatically Expand all levels from Options Icon>Configure>List Column Section>Options. Portlet supports up to 10 levels of WBS. Portlet filterable by project name and ID, OBS structure, manager name, active/inactive, and open for time entry.
 -
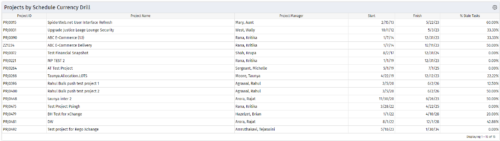
 This portlet shows the variance between the budgeted cost and the planned cost for projects. This allows for the variance to be displayed between what was planned and what was approved. This provides the PMs with the ability to better plan the costs.
 -
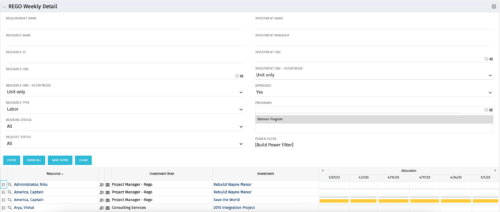 This is the same portlet as the out of the box Weekly Detail with an additional filter element for Program (multiple select). Portlet displays resource allocations graphically for each project in the specified program(s), for the next six weekly periods. Portlet filterable by numerous project, resource, and assignment attributes. Graphical representation shows Resource Availability Threshold and Allocation in hours, as a mouse-over.
 -
 “Resources with No Basic Matrix Entry” portlet displays combinations of project and resource where the assigned resource does or does not have a rate established for that project. Portlet is filterable by Projects, Project ID, Resources, and Missing Rate (Yes, No, All). How does this work? The Rate Matrix Extraction job populates a record into the NBI_PROJ_RES_RATES_AND_COSTS table for every resource/project combination that meets any of the rate matrix criteria. This portlet checks that table, and sets the Missing Rate attribu
 -

 The portlet shows the project spend to vendors by month. The Vendor field picked on the portlet comes from the Vendor mentioned when creating the voucher (as displayed on the first screenshot). This provides a nice view of identifying how much is spent by an organization on the vendor employees on their workforce.
 -
The portlet shows the project spend to vendors by month. The Vendor field picked on the portlet comes from the Vendor mentioned when creating the voucher (as displayed on the first screenshot). This provides a nice view of identifying how much is spent by an organization on the vendor employees on their workforce.
-
 Pie Chart Portlet displays counts of active projects with various Stale ratings. Calculation is Percent Stale Tasks = number of open (not completed) tasks with a finish date over 15 days old, divided by total open tasks. Filterable by OBS structure and project manager. Data label = project count. Mouse-over and Legend labels = stale rating. More than 90% Stale means 90 to 100% of open tasks on a project have finish dates older than 15 days. More than 80% Stale means 80 to 89% of open tasks on a project have finish dates older than 15 days. Less than 70% Stale means fewer than 70% of open tasks on a project have finish dates older than 15 days. By clicking on pie slice, a drilldown grid portlet appears with listing of projects and their Stale Ratings.
 -
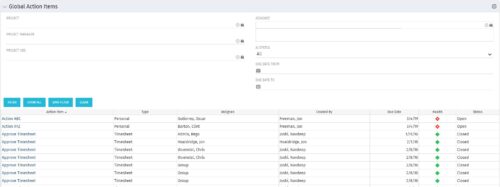 The Global Action Items portlet will help users and clarity admins to keep track of action items in the CA PPM system. This is useful to keep track of Timesheet Approval through Action Item or any other Action Item related workflows. The portlet displays Name, Type Assignee, Created by, Due Date, Health and Status of the Action Items as default columns. The portlet provides Project, Project Manager, Project OBS, Assignee, Status and Due Dates of the Action Items as default filters.
 -
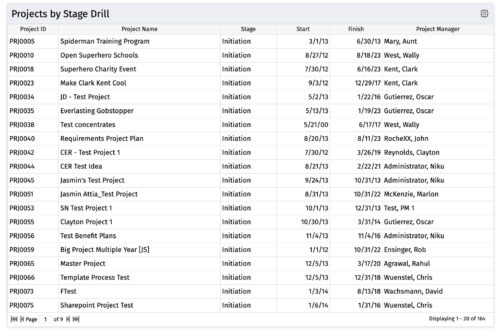
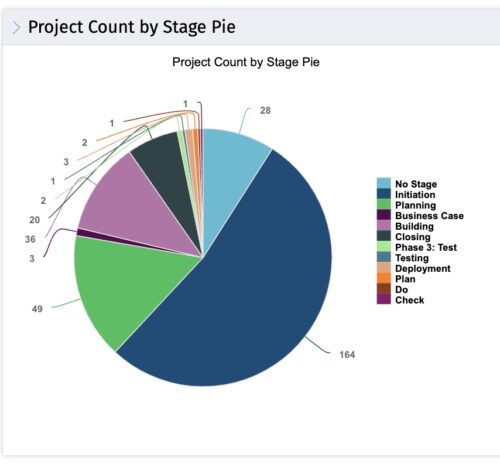 The portlet, Count by Stage with Drilldown is a simple pie based on stage OOTB field. The drill down portlet has stage as a column. Clicking on any of the segments, e.g. Initiation, redirects to the Projects by Stage Drill portlet.
 -
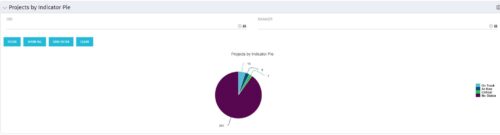
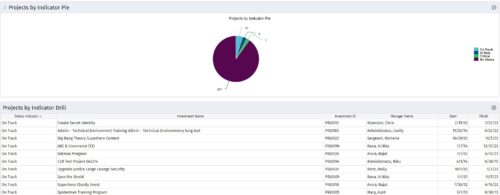 Pie Chart displays counts of all projects by out-of-box Status Indicator attribute. Filterable by OBS structure and Manager. Data label displays count. Mouse-over and Legend display Indicator name. Chart also displays count for projects with no Indicator. By clicking on a pie slice, a grid portlet appears displaying all projects with that indicator value.
 -
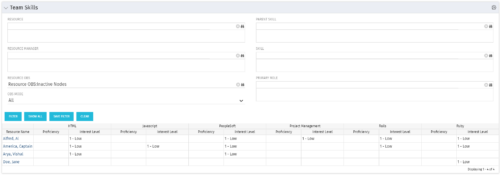 The Team Skills portlet displays Skill Proficiency and Interest Level by Resource. Users can utilize this view to search for Resources by Skill, Parent Skill, Interest, Role, Parent Role, Resource and Resource OBS. This portlet grants a Project Manager or Resource Manager the ability to determine which Resources best fit the needs for their project.
 -
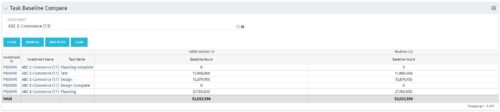 The Task Baseline Compare portlet displays the tasks in a specific Investment and provides the ability to compare the baseline hours for the tasks in each version of the baseline.
 -
The Task Baseline Compare portlet displays the tasks in a specific Investment and provides the ability to compare the baseline hours for the tasks in each version of the baseline.
-
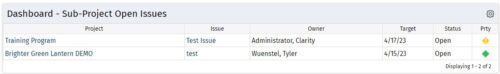 The Program Dashboard Sub-Project Open Issues portlet gives the ability to view issues on sub-projects of a program that are not closed or resolved. The portlet will pull the "id" from the page it is placed on, so this portlet is usually placed on the dashboard tab. The portlet sorts the issues first by priority and then by target date. It displays the sub-project name, issue name, owner, target date, status and priority.
 -
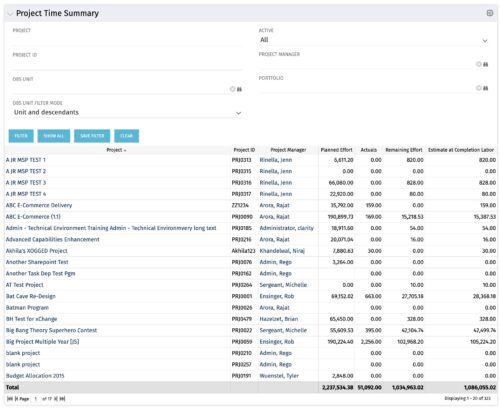 Project managers may use this portlet to show the planned effort and the remaining effort on projects. Includes actual hours as well as estimate at completion. You may narrow the results by filtering by project name, project manager, project OBS, or active flag. The portlet will display each project by ID, name, project manager, planned effort (total allocation hours), actual hours, remaining effort (ETC), and estimate at complete (actual + ETC).
 -
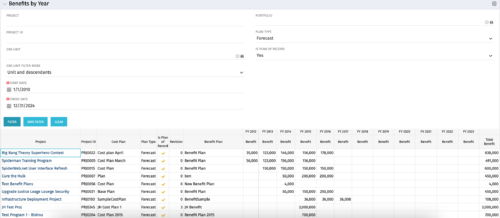 The Benefits by Year portlet summarizes Benefit totals by year and is searchable by Project, OBS and Portfolio. The results display both Budgeted Benefit Plans and Forecast Plans and the associated Cost Plan. Users can make use of this portlet to view Benefit Plan totals across an OBS or Portfolio or to compare the Budgeted Benefit of a Project versus the current plan.
 -
The Benefits by Year portlet summarizes Benefit totals by year and is searchable by Project, OBS and Portfolio. The results display both Budgeted Benefit Plans and Forecast Plans and the associated Cost Plan. Users can make use of this portlet to view Benefit Plan totals across an OBS or Portfolio or to compare the Budgeted Benefit of a Project versus the current plan.
-
 The Dashboard: Project Status Single-line portlet gives an overview of the project overall status as well as the status indicators on the "current" status report object. The portlet will pull the "id" from the page it is placed on, so this portlet is usually placed on the project dashboard tab. This portlet displays the report date, symbols relating to the overall status, scope, schedule, cost/effort, and the overall explanation across a single line in the portlet.
 -
 The Dashboard: Project Information portlet gives a set of high-level information about the project. The portlet will pull the "id" from the page it is placed on, so this portlet is usually placed on the project dashboard tab. The portlet displays the name, project ID, project manager, description, start date, finish date, baseline start, and baseline finish.
 -
 The Time By Type - Pie Chart portlet is a graphical representation of time by type of investment for all resources the logged in user has security rights to view. This portlet pulls from the daily timeslices, and can be used for determining what types of projects receive the majority of hours. The filter option allows for entry of a specific start date and finish date.
 -
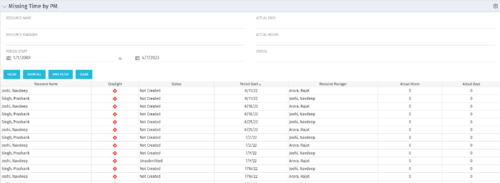 The Missing Time by PM portlet displays all missing or late timesheets for resources staffed on a project where the logged in user is the project manager. Resources will be listed if they are open for time entry, have a track mode of Clarity, and have timesheet that is not posted (accommodates for hire and termination dates). Project managers may use this portlet to determine the timesheet status of resources staffed on their projects. You may narrow the results by filtering by resource manager, period start, resource name, or status. The portlet will display an indicator based on timesheet status, the status, period start, resource name, and actual hours for the timesheet.
 -
The Missing Time by PM portlet displays all missing or late timesheets for resources staffed on a project where the logged in user is the project manager. Resources will be listed if they are open for time entry, have a track mode of Clarity, and have timesheet that is not posted (accommodates for hire and termination dates). Project managers may use this portlet to determine the timesheet status of resources staffed on their projects. You may narrow the results by filtering by resource manager, period start, resource name, or status. The portlet will display an indicator based on timesheet status, the status, period start, resource name, and actual hours for the timesheet.
-
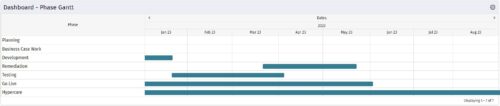 The Dashboard: Phase Gantt portlet gives an overview of all WBS level 1 tasks or milestones for a single project. The portlet will pull the "id" from the page it is placed on, so this portlet is usually placed on the project dashboard tab. The portlet displays the name, and a graphical representation of the timeline for the phases. The date range may be configured by day, month, year, or quarter. The start date may also be configured to any date or a relative date (start of current month, start of next year, etc).
 -
The Dashboard: Phase Gantt portlet gives an overview of all WBS level 1 tasks or milestones for a single project. The portlet will pull the "id" from the page it is placed on, so this portlet is usually placed on the project dashboard tab. The portlet displays the name, and a graphical representation of the timeline for the phases. The date range may be configured by day, month, year, or quarter. The start date may also be configured to any date or a relative date (start of current month, start of next year, etc).
-
 The Dashboard: Open Risks portlet gives an overview of all risks that are not closed or resolved for a single project. The portlet will pull the "id" from the page it is placed on, so this portlet is usually placed on the project dashboard tab. The portlet sorts the risks first by priority and then by target date. It displays the name, owner, target date, probability impact, and priority.
 -
 The Dashboard: Open Milestones portlet gives an overview of all milestones that are started or not started for a single project. The portlet will pull the "id" from the page it is placed on, so this portlet is usually placed on the project dashboard tab. The milestones are sorted by Due Date. It displays the name, Due Date, Baseline Date, Days Late (Due Date – Baseline Date), and Days Old (Current Date – Due Date).


Copyright 2023 • Rego Consulting Corporation • Privacy Policy