-
 Do you want to add interfaces to your CA PPM instance? This class will review the pros and cons of various integration methods and provide best practice on how to handle various interfaces. We’ll walk you through specific interface examples and showcase Rego’s pre-built interface sets you can leverage to reduce the time and cost of implementation.
 -
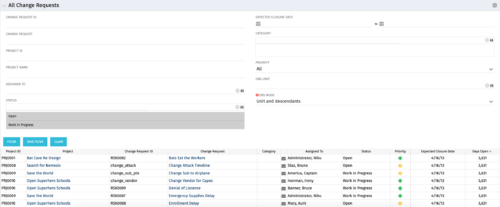 The All Change Request portlet displays all change requests related to active projects that the logged in user has view rights to. The portlet provides the project manager a single place to view change requests across multiple projects without having to go into each project individually and allows for more efficient management and reporting across projects. The filter allows the user to narrow their search by date ranges, resources involved, and/or the project with which the Change Request is associated. Other alternatives for filtering include the category, priority or status of the Change Request. In the list view, a status is displayed for each Change Request (CR), along with the Project with which the CR is associated, the CR ID, the CR name, the resource to whom the CR is assigned, Priority, Expected Closure Date, and number of days the CR has remained open. Note: Only the projects that the user has viewer rights to will show up in the list.
 -
 The Rego PowerBI Reporting Suite features close to 100 free PowerBI reports, designed to enhance project management and reporting capabilities.
 -
 Bringing back a classic topic with a modern update! Join this session to discuss tips and tricks for an optimized PMO experience in Clarity. This session is designed so attendees can share, collaborate, and benefit from their diverse experiences.
 -
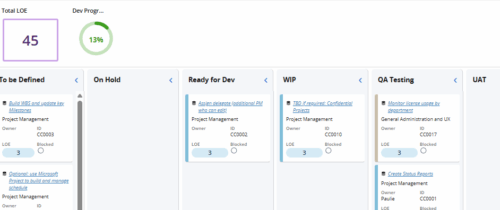 Leverage a Kanban or Sprint approach to manage Clarity Implementation and ongoing improvements. List also serves as a history of configuration changes, reasons, and deployment dates.
 -
 This class explores the future of AI in project management, highlighting innovative use cases for predictive analytics. Participants will gain insights into how emerging AI technologies and gather an understanding between Predictive Analytics and AI.
 -
 This training document is a Rego Consulting Quick Reference Guide to assist with the creation of Risks, Issues and Changes in Clarity’s Modern User Experience. This doc references version 16.2.1 views. Doc covers creating and management of these project tools.
 -
 This training document is a Rego Consulting Quick Reference Guide to assist with the adding of resources to the Staff tab for Ideas in Clarity’s Modern User Experience. This doc references version 16.1.2 views. Document provides detail on how to add resources to the Staff tab, Default Allocation % and Per-Period metrics.
 -
 This training document is a Rego Consulting Quick Reference Guide to assist with the utilization of the My Workspace area within Clarity’s Modern User Experience. This doc references version 16.1.2 views. Document reviews Checklists, Smartlists and To Do’s.
 -
 Lean Portfolio Management (LPM) is one of the seven SAFe components of the Lean Enterprise. LPM helps organizations solve numerous challenges by decreasing the delivery of time to value, enabling the organization to pivot quickly in ever-shifting markets, and more.
 -
 This training document is a Rego Consulting Quick Reference Guide to assist with the use of Sub-Objects and Channels in Clarity’s Modern UX.
 -
 This training document is a Rego Consulting Quick Reference Guide to assist with Status Reporting in Clarity’s Modern User Experience. The document reviews Status Reporting via the Status Tab and the Status Reporting Tab – Grid View.


Copyright 2023 • Rego Consulting Corporation • Privacy Policy