RegoXchange
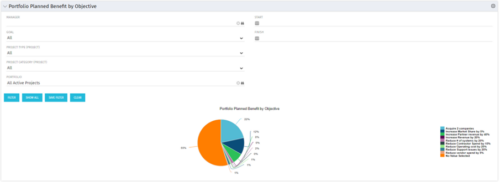
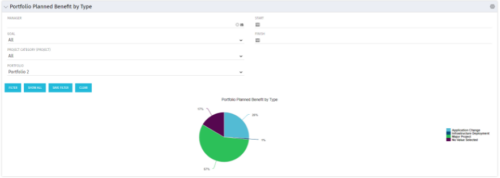
  • Part of the Business Transformation collection, this pie chart portlet displays realized benefit, grouped by type of project, for portfolio investments. It uses System Provider: Portfolio Investment Provider.
  • Part of the Business Transformation collection, this pie chart portlet displays realized benefit, grouped by type of project, for portfolio investments. It uses System Provider: Portfolio Investment Provider.
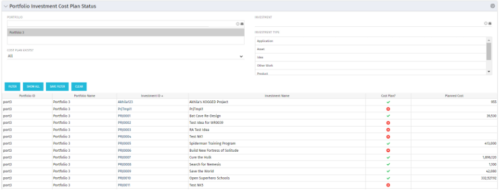
  • The portlet shows which investments within a portfolio has a cost plan and those that do not. For the ones which do have a cost plan, the Cost Plan? Field shows a Green checkmark.  For the ones which do not have a cost plan, the Cost Plan? Field shows a Red cross.
  • The portlet shows which investments within a portfolio has a cost plan and those that do not. For the ones which do have a cost plan, the Cost Plan? Field shows a Green checkmark.  For the ones which do not have a cost plan, the Cost Plan? Field shows a Red cross.
  • The portlet shows which investments within a portfolio has a cost plan and those that do not. For the ones which do have a cost plan, the Cost Plan? Field shows a Green checkmark.  For the ones which do not have a cost plan, the Cost Plan? Field shows a Red cross.
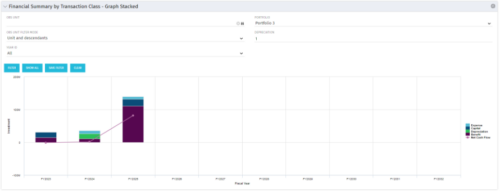
  • This stacked bar graph portlet displays the financial summary by transaction class for the current and future fiscal annual periods.  Filters are provided for:
    1. OBS
    2. Portfolio
  • This stacked bar graph portlet displays the financial summary by transaction class for the current and future fiscal annual periods.  Filters are provided for:
    1. OBS
    2. Portfolio
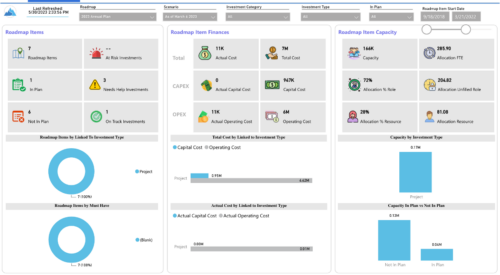
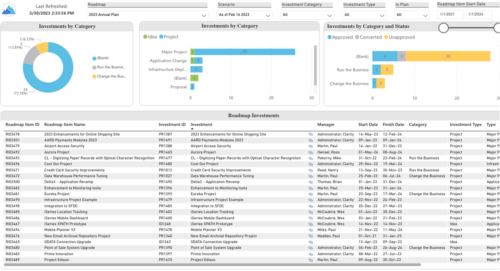
  • Plan your future work by comparing different scenarios, including in-flight work, and determine the best course of action for your organization.  Report Views include:
    • Roadmap Details
    • Resource Investment Demand
    • Roadmap Financials
    • Roadmap Investment Gantt
    • Roadmap Item Gantt
    • Roadmap Overview – Default Scenarios
    • Roadmap Overview – Single Roadmap Selection
    • Scenario Comparison
    Demo Video -  https://www.youtube.com/watch?v=RjdvrRd4ZG0&list=PLXJ5ktuWV0jiS9CvBpHvBIwpKPmA9uvwK&index=7 The main .rpt file will access data through the Data Warehouse.  For clients on Rego’s AWS hosting, we have versions that work with Oracle and Postgres DB and access the live database, if the Rego Odata connector is being used.
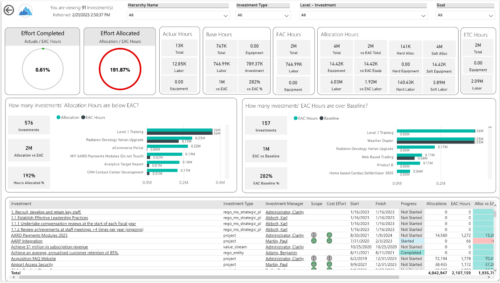
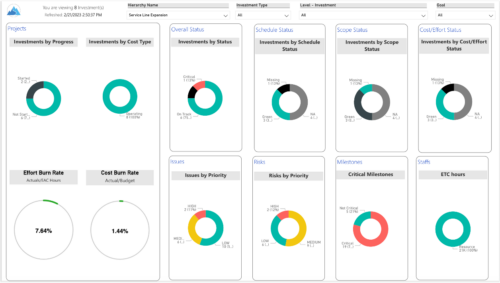
  • Summarize an ad hoc list of investments or leverage your defined hierarchies to visualize and evaluate the performance of your portfolios, including financial data analysis.  Report Views include:
    • Change Requests
    • Cost Trend
    • Cost
    • Effort Trend
    • Effort
    • Hierarchy Summary
    • Investment Drill Thru
    • Investment Gantt
    • Issue Summary
    • Milestones
    • Risk Summary
    • Staff
    • Status Report Summary
    • Tasks
    Demo Video -  https://www.youtube.com/watch?v=UNByLAWJ2Nw&list=PLXJ5ktuWV0jiS9CvBpHvBIwpKPmA9uvwK&index=4 The main .rpt file will access data through the Data Warehouse.  For clients on Rego’s AWS hosting, we have versions that work with Oracle and Postgres DB and access the live database, if the Rego Odata connector is being used.
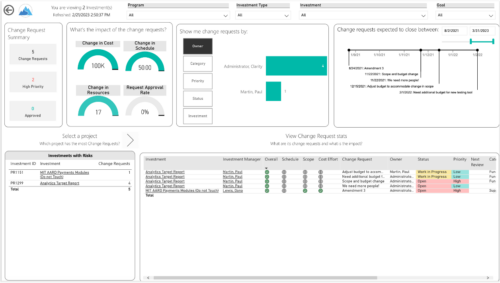
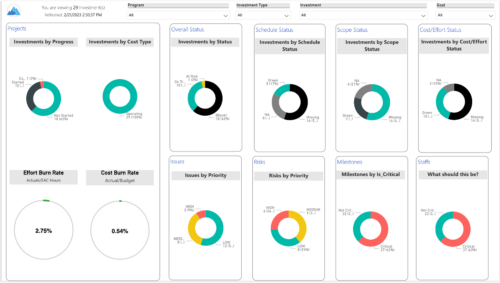
  • Gain an overview of program-level performance, track program milestones, and assess overall program health.  Report Views include:
    • Change Requests
    • Program Costs Trend
    • Program Costs
    • Program Drill Thru
    • Program Effort
    • Program Gantt
    • Program Issues
    • Program Milestones
    • Program Risks
    • Program Staff
    • Program Status Reports
    • Program Summary
    • Program Tasks
    Demo Video -  https://www.youtube.com/watch?v=6VceDIFjp-g&list=PLXJ5ktuWV0jiS9CvBpHvBIwpKPmA9uvwK&index=5 The main .rpt file will access data through the Data Warehouse.  For clients on Rego’s AWS hosting, we have versions that work with Oracle and Postgres DB and access the live database, if the Rego Odata connector is being used.
  • Part of the Business Transformation collection, this pie chart portlet displays realized benefit, grouped by category for portfolio investments. It uses System Provider: Portfolio Investment Provider.
  • Part of the Business Transformation collection, this pie chart portlet displays realized benefit, grouped by category for portfolio investments. It uses System Provider: Portfolio Investment Provider.
Go to Top