-
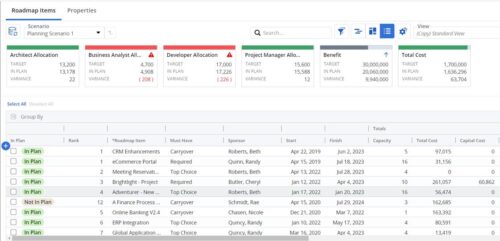
 This Roadmap add-on provides configurable Role-based metrics that can be used in the grid view as targets and constraints. Select your valuable roles in the “targets” and once selected, the “sync” button will bring in any current allocations against projects and allow editing any of the total numbers directly in a scenario. This will provide deeper insights into impacts of plans on teams/resources in addition to the out of the box money and time constraints.
 -
 Out of the box, there is no way to export or report on the Modern UX Roadmap Grid view. This report allows the end user to select one or more roadmaps and provides an exportable view of several OOTB fields from those roadmaps. When exported to and open in excel, the first tab will display a combined view of all selected Roadmaps, one row for every Roadmap Item, and additional tabs will display Roadmap-specific views. Custom attributes may be added to the report by your developers.
 -
 Out of the box, there is no way to export or report on the Modern UX Roadmap Grid view. This report allows the end user to select one or more roadmaps and provides an exportable view of several OOTB fields from those roadmaps. When exported to and open in excel, the first tab will display a combined view of all selected Roadmaps, one row for every Roadmap Item, and additional tabs will display Roadmap-specific views. Custom attributes may be added to the report by your developers.


