RegoXchange
  • A Quick Reference Guide to assist in configuring the layout of Ideas and Custom Investments in Clarity’s Modern UX via Blueprints.  Reviews the configuration process including changes to Details and Modules.
  • A Quick Reference Guide to assist in the process of converting a Idea into an Investment in Clarity.  Includes information on adding financial and resource data into the new investment.
  • A Quick Reference Guide on setting up Custom Investments in Clarity’s Modern UX.  Reviews setting up the Custom Investment, and creating Custom Investment Records.
  • This training document is a Rego Consulting Quick Reference Guide to assist with creating Custom Investments in Clarity’s Modern User Experience.  The document reviews creating a Custom Investment Type and creating a Custom Investment Record.
  • Funnel Chart displays aggregated counts of Ideas by “Idea Progress”, a custom attribute.  Chart shows Idea Progress names in legend, and count total is available as a mouse-over.  No filters available on this portlet.
  • Funnel Chart displays aggregated counts of Ideas by “Idea Progress”, a custom attribute.  Chart shows Idea Progress names in legend, and count total is available as a mouse-over.  No filters available on this portlet.
  • Funnel Chart displays aggregated counts of Ideas by “Idea Progress”, a custom attribute.  Chart shows Idea Progress names in legend, and count total is available as a mouse-over.  No filters available on this portlet.
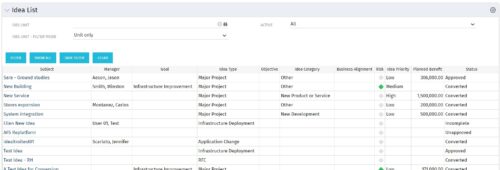
  • Part of the Business Transformation collection, this grid portlet displays idea details for all ideas (active and inactive) and all status conditions.  This is an editable portlet based on the Ideas data provider.  Filterable by OBS structure, Active/Inactive, and Status.
  • Part of the Business Transformation collection, this grid portlet displays idea details for all ideas (active and inactive) and all status conditions.  This is an editable portlet based on the Ideas data provider.  Filterable by OBS structure, Active/Inactive, and Status.
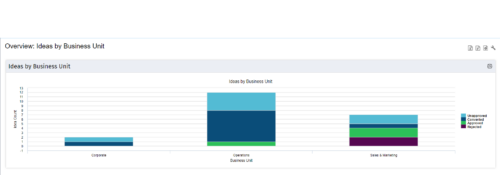
  • Part of the Business Transformation Content collection, this bar chart portlet displays count of ideas per business unit. This provides a holistic view of the idea pipe-line in an organization providing them a high-level of ideas converted, approved, unapproved per business unit.
  • Part of the Business Transformation Content collection, this bar chart portlet displays count of ideas per business unit. This provides a holistic view of the idea pipe-line in an organization providing them a high-level of ideas converted, approved, unapproved per business unit.
  • Part of the Business Transformation Content collection, this bar chart portlet displays count of ideas per business unit. This provides a holistic view of the idea pipe-line in an organization providing them a high-level of ideas converted, approved, unapproved per business unit.
  • Pie Chart displays count of all Ideas by Department.  Filterable by Active and Inactive, by OBS, and by Department Manager.  Data label and mouse-over show department counts.  Legend displays department names.
  • Pie Chart displays count of all Ideas by Department.  Filterable by Active and Inactive, by OBS, and by Department Manager.  Data label and mouse-over show department counts.  Legend displays department names.
  • Pie Chart displays total Ideas by Priority, filterable by Active / Inactive and by OBS structure.  Data Label and Mouse-over label display counts by Priority.  Legend shows Priority Name.  Chart also shows Ideas with No Priority.
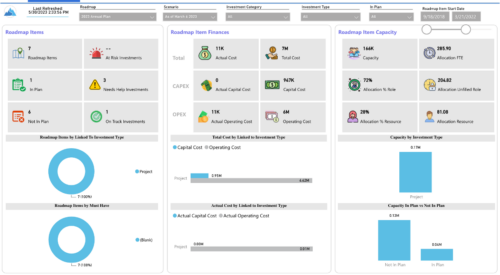
  • Plan your future work by comparing different scenarios, including in-flight work, and determine the best course of action for your organization.  Report Views include:
    • Roadmap Details
    • Resource Investment Demand
    • Roadmap Financials
    • Roadmap Investment Gantt
    • Roadmap Item Gantt
    • Roadmap Overview – Default Scenarios
    • Roadmap Overview – Single Roadmap Selection
    • Scenario Comparison
    Demo Video -  https://www.youtube.com/watch?v=RjdvrRd4ZG0&list=PLXJ5ktuWV0jiS9CvBpHvBIwpKPmA9uvwK&index=7 The main .rpt file will access data through the Data Warehouse.  For clients on Rego’s AWS hosting, we have versions that work with Oracle and Postgres DB and access the live database, if the Rego Odata connector is being used.
  • A Quick Reference Guide to assist in managing a Custom Investment in Clarity’s Modern UX.  Reviews accessing the Custom Investment Link and navigating the tabs.
  • This training document is a Rego Consulting Quick Reference Guide to assist with management of Custom Investments in Clarity’s Modern User Experience.  The document reviews navigation to a custom investment and then the various tabs related to the management of the investment.
  • Course description: “Are you an NPD CA PPM user? This session is dedicated to NPD users to discuss some of the unique requirements and configurations needed to support project management for new product development.”  Download file is the slide deck used for the presentation.
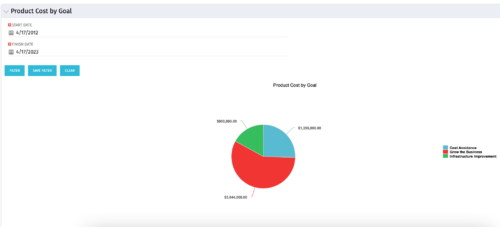
  • The Product Cost by Goal portlet displays the planned cost of all active products within a timeframe, summarized by goal in a pie chart. This portlet provides management with a quick overview of cost by goal within a year without navigating to each product individually.
  • The Product Cost by Goal portlet displays the planned cost of all active products within a timeframe, summarized by goal in a pie chart. This portlet provides management with a quick overview of cost by goal within a year without navigating to each product individually.
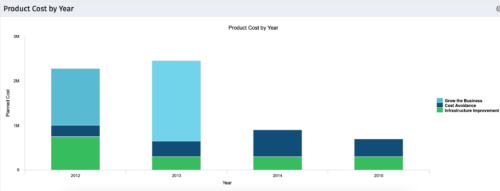
  • The Product Cost by Year portlet displays active product cost by year, summarized by goal. The product cost is pulled from the product’s planned cost and is displayed by year, with colors representing each product goal. This portlet provides management with a quick overview of all product costs without having to navigate to each product individually.

  • The Product Cost by Year portlet displays active product cost by year, summarized by goal. The product cost is pulled from the product’s planned cost and is displayed by year, with colors representing each product goal. This portlet provides management with a quick overview of all product costs without having to navigate to each product individually.
  • The Product Risk by Goal portlet displays a count of active products by goal with a sub-count by risk. The graph is color-coded by risk rating:
    • 1-33 – Green
    • 34-66 – Yellow
    • 67-100 – Red
    The portlet provides a quick overview of the risk rating for each product within each goal.
Go to Top