-
 Many organizations are moving from a waterfall development approach toward agile methodologies and frameworks. This transformation impacts the financial structure of IT and can create changes in the way the TBM model needs to be built. In this session we will give a high-level overview of what an Agile Business Operating Model is and the potential impacts it could have so you can understand how to integrate this into your TBM practice.
 -
 Do you want to talk to other customers that are using or plan to use financial management? In this moderated Round Table where customers can share experiences and provide insights on process, configurations, challenges, and successes. We will have an expert panel and then divide into small groups and discuss customer selected topics - 100% sharing.
 -
 Have you ever reviewed costs with your stakeholders and suddenly noticed an unexpected change? This class will teach you all the techniques you need to trace down the cause of the discrepancies in the model. We will cover advanced troubleshooting techniques like Metric view for tracing up/down the model and how to leverage model summary reports.
 -
 This portlet shows the project costs by Month. The information displayed includes:
- Start Date for project
- End Date for project
- Budgeted Cost
- Planned Cost
- Actual Hours
-
 This training document is a Rego Consulting Quick Reference Guide to assist with the creation of financial plans within Ideas in Clarity’s Modern User Experience. This doc references version 16.0.3 views. Document includes instructions on how to create cost plans, budget plans and benefit plans.
 -
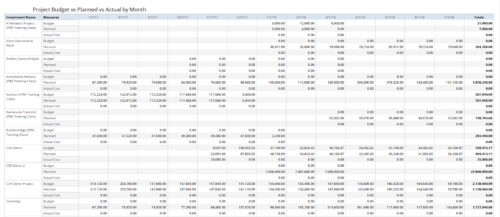 Project Budget vs Planned vs Actual by Month report provides the Project Managers a single place to view Project Budget, Planned and Actual Cost for multiple projects. Project Managers can use this view to compare various costs for that project in a particular month. User can further narrow their search by OBS Type & Path, Is Project Active?, Fiscal Month Start Date, Investment Manager and Investment Name.
 -
 Course Description: Do you want to analyze the cost and utilization of Agile development resources? Do you struggle to integrate financial information with work execution information from Agile tools such as Rally Software®, Jira, or VersionOne? This session explores reporting and dashboarding approaches to provide technology leaders with KPIs and trends for Agile execution, along with views that relate Agile team activity with cost and delivery.
 -
 This Portlet produces a Grid View of Resources using total Resource Allocation from each Project’s Team / Staff, per month; output is expressed as a %. Users can specify which Resource OBS to use as a Filter (unit and descendants is assumed) as well as a Start/End Date.
 -
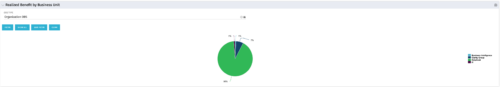 Pie Chart that aggregates Realized Benefit (Total Actual Benefit) by OBS for active projects. Only a Benefit Plan associated with the Cost Plan of Record will return data. The filter allows you to select which OBS filter you prefer to use for this pie chart, however, only an OBS associated with Projects will return data.
 -
 Part of the Business Transformation collection, this bar-chart portlet displays number of investments per stage. This provides a holistic overview of where the projects are within the organization.
 -
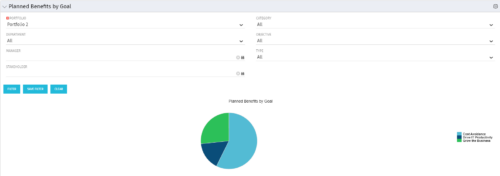 Part of the Business Transformation Package, this pie chart portlet shows planned benefits across the system grouped by Goal. The data is displayed form the investments in a portfolio. The portlet lets the Portfolio Manager know on which GOAL the planned benefit is allocated, so as to target the overall investment spread in the portfolio.
 -
 The portlet shows the Overall Status and Budget Status and Amounts. It displays one row per project. The portlet shows the following main fields: Overall Status, Budget Status, Capital Budget, Operating Budget, Total Budget, Capital Planed, Operating Planned, Total Planned, Capital Actuals, Operating Actuals, Total Actuals, Budget Variance ($), Budget Variance (%) Displaying the budget variance allows the PM to understand of the project is over / under spent, and thus the costs planning needs to be re-visited.


Copyright 2023 • Rego Consulting Corporation • Privacy Policy