-
 Does your organization own Apptio or looking to purchase it? In this session we will dive into what Apptio is and how it complements your current Clarity solution.
 -
 A review of how Northern Trust integrates financial systems with Clarity PPM bilaterally, providing the Finance organization crucial information, and NT Project Managers with a birds-eye view of project financials. Utilizing the Rego Data Extractor and the Rego Data Processor, these information exchanges help Portfolio and Project Managers eliminate their manual and redundant efforts, solidify their overall data accuracy, and dramatically improve the content provided to their Execs for decision-making.
 -
 Rally Software introduction including high level feature and functionality for Agile and portfolio planning and tracking, analytics and reporting, and overall benefits of Rally in the marketplace along with a product demo.
 -
 Course Description: Do some folks in your organization view Clarity PPM as worthless or of little value? In this class, we will discuss how to increase the value perception of Clarity PPM and innovative ways to sell the value Clarity PPM provides to stakeholders and users.
 -
 Most organizations use CA PPM as part of an annual planning process, in conjunction with an ITFM or financial system. There is often a struggle to know where CA PPM fits into the process and how to effectively connect the data and processes between these tools. In this class, we will discuss how a PPM tool and an ITFM tool fit together to support annual planning.
 -
 Today, most high-performing organizations recognize that moving from project-funding to product-funding is necessary for achieving business agility. What doesn't exist in the industry is guidance on how to support the transition from a tooling perspective. In this session, Rego Expert Guide Robert Sirard presents a practical and tactical approach to using Clarity's PPM software and Rally's Agile software together to plan, track, monitor, and deliver products. At Rego, we realize that not everything needs to be done in an Agile manner, so Robert will discuss how this approach also supports a mix of traditional and Agile investments. ** No Download - Do not Add to Cart ** There is no download for this content. Follow the link to view - http://info.regoconsulting.com/product-funding-clarity-rally-may-2021
 -
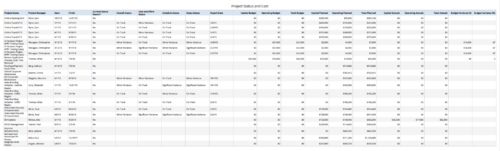 Project Status and Costs report gives the Project Manager a single place to view various Project Statuses ( Cost and Effort, Schedule, Scope and Overall ) and Costs ( Planned, Budget & Actuals ) for multiple projects. User can further narrow their search by OBS Type & Path, Project Name, Project Manager and Is Project Active?.
 -
 A presentation slide deck from Rego University 2022. This course reviewed the value of a strategic roadmap for TBM.
- Defining the Value of a Strategic Roadmap
- Roadmapping Methodology
- Best Practices
- TBM Roadmap Examples
-
 A presentation slide deck from Rego University 2022. This course was a review of the power of perception and how to improve on the adoption of Apptio.
- The Perception of Apptio
- The Perception of Adoption
- Driving Adoption
- Measuring Success
-
 This training document is a Rego Consulting Quick Reference Guide to assist with the creation of Benefit Plans in Clarity’s Modern User Experience. This doc references version 16.0.2 views. Doc provides detail on how to create a Benefit Plan, how to categorize Benefit Class and Benefit Subclass, how to add financial values to your Benefit Plan, and how to add the Benefit Plan to your Cost Plan.
 -
 This training document is a Rego Consulting Quick Reference Guide to assist with the entering of financial transactions in Clarity’s Classic User Experience. This doc references version 16.0.2 views. Document provides basic information on the definition of a transaction and the composition of transaction items. Detail is provided on how to create a new transaction from the Transaction Entry page of the Classic User Experience. Information is provided on how to enter detail into each individual line item for a transaction.
 -
 This training document is a Rego Consulting Quick Reference Guide to assist with the creation of Benefit Plans in Clarity’s Modern User Experience. This doc references version 16.0.3 views. Doc provides detail on how to create a Benefit Plan, how to categorize Benefit Class and Benefit Subclass, how to add financial values to your Benefit Plan, and how to add the Benefit Plan to your Cost Plan.


Copyright 2023 • Rego Consulting Corporation • Privacy Policy