-
 Discover the growing trend of organizations adopting the FinOps methodology and its integration with the TBM framework. In this session, we'll explore how the TBM office and FinOps teams can collaborate effectively to achieve desired outcomes, fostering a synergistic relationship between them, and leveraging the combined capabilities of Apptio and Cloudability for optimal results.
 -
 Most organizations struggle with collaborating across frameworks. Those managing FinOps activities, the TBM office, and Agile delivery teams are operating in silos, but there is a better way forward. In this class we’ll go through some strategies of bringing teams together to improve business outcomes through collaboration.
 -
 We will delve into various examples of how to use Apptio reports to identify cost-saving opportunities within your organization and how to quantify them for leadership. We will cover specific areas such as databases, migrating servers to the cloud, rationalizing applications with high unit costs, replacing or decommissioning obsolete servers, and managing unassigned end-user devices.
 -
 Apptio can be used for so much more than App TCO and Service Costing. Let's talk about valuable non-traditional use cases you might want to consider exploring.
 -
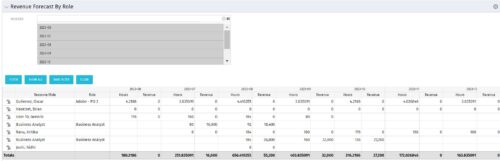 The Revenue Forecast by Role portlet displays forecasted revenue by both resource and role on the given project, broken out by month. The table below describes the available filter fields in the portlet.
Column Label Description Months Fiscal months to display -
 Part of the Business Transformation collection, this pie chart portlet displays realized benefit, grouped by category for portfolio investments. It uses System Provider: Portfolio Investment Provider.
 -
 Part of the Business Transformation Collection, this bubble-chart portlet displays investments per their alignment, status and total planned benefit. The: X-axis displays the alignment Y-axis displays the status Bubble-size displays the total planned benefit
 -
Part of the Business Transformation Collection, this bubble-chart portlet displays investments per their alignment, status and total planned benefit. The: X-axis displays the alignment Y-axis displays the status Bubble-size displays the total planned benefit
-
 The Financial Summary by Transaction Class - Graph provides a visual graph for each years financial picture beginning with current year and going forward into the future. It will show the user where they need to concentrate their efforts in order to meet financial commitments.
 -
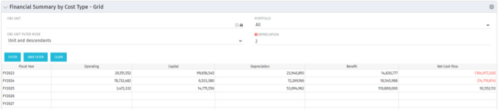 The Financial Summary by Cost Type - Grid is very beneficial as it provides actual numbers for each years financial picture beginning with current year and going forward into the future. It will show the user where they need to concentrate their efforts in order to meet financial commitments.
 -
The Financial Summary by Cost Type - Grid is very beneficial as it provides actual numbers for each years financial picture beginning with current year and going forward into the future. It will show the user where they need to concentrate their efforts in order to meet financial commitments.
-
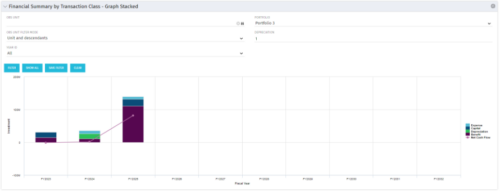 This stacked bar graph portlet displays the financial summary by transaction class for the current and future fiscal annual periods. Filters are provided for:
- OBS
- Portfolio


Copyright 2023 • Rego Consulting Corporation • Privacy Policy