-
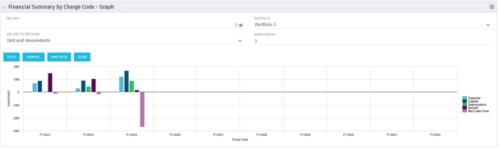 The Financial Summary by Charge Code - Graph portlet displays yearly charge code financial information across all projects in a bar graph. This portlet provides management with a snapshot of all projects’ financial information totaled and sorted by expense, capital, depreciation, benefit, and net cash flow. The depreciation is calculated based on a straight line method. The user may filter on OBS unit and/or portfolio to narrow down the search results.
 -
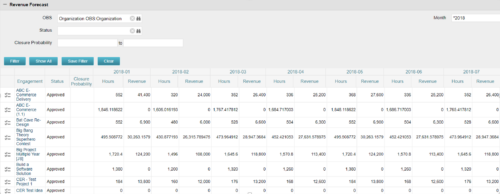
The Revenue Forecast portlet displays projected revenue at a project level broken out by month. This portlet assists in viewing all project revenue data at once and making it easily exportable. The table below describes the available filter fields in the portlet. Column Label Description OBS OBS to filter projects with Status Status of the project Closure Probability ? Months Month(s) of Project Revenue to display -
The Revenue Forecast portlet displays projected revenue at a project level broken out by month. This portlet assists in viewing all project revenue data at once and making it easily exportable. The table below describes the available filter fields in the portlet. Column Label Description OBS OBS to filter projects with Status Status of the project Closure Probability ? Months Month(s) of Project Revenue to display -
 This training document is a Rego Consulting Quick Reference Guide to assist with the management of project Financials in Clarity’s Modern User Experience. This doc references version 16.0.3 views. Document includes summary information on the Financials module and provides detail on how to customize the grid and save views. Instructions are provided on how to filter data and how to use the ⋮ (vertical ellipses) icon to access further features. Detail is provided on the group by function, the column panel, the export of cost plan and editing cost plan and budget plan data from the grid.
 -
 This training document is a Rego Consulting Quick Reference Guide to assist with the entering of financial transactions in Clarity’s Classic User Experience. This doc references version 16.0.3 views. Document provides basic information on the definition of a transaction and the composition of transaction items. Detail is provided on how to create a new transaction from the Transaction Entry page of the Classic User Experience. Information is provided on how to enter detail into each individual line item for a transaction.
 -
 This training document is a Rego Consulting Quick Reference Guide to assist with the management of project Financials in Clarity’s Modern User Experience. This doc references version 16.0.2 views. Document includes summary information on the Financials module and provides detail on how to customize the grid and save views. Instructions are provided on how to filter data and how to use the ⋮ (vertical ellipses) icon to access further features. Detail is provided on the group by function, the column panel, the export of cost plan and editing cost plan and budget plan data from the grid.
 -
 This training document is a Rego Consulting Quick Reference Guide to assist with the management of Budget Plans in Clarity’s Modern User Experience. This doc references version 16.0.2 views. Doc provides detail on how to submit a cost plan for approval, how to approve or reject submitted budgets and also provides additional detail on the rules that apply to the submission of budget plans.
 -
 A presentation slide deck from Rego University 2022. This course in the Apptio track was about analyzing cost drivers to understand why cost could be changing.
- Questions we’re looking to answer
- Scenarios
- Tools
-
 A presentation slide deck from Rego University 2022. This course was about understanding TBM and positioning its value with your organization. • What is TBM • TBM Value • A TBM “Transformation” • TBM Value in Practice
 -
 A presentation slide deck from Rego University 2022. A class about the goal of TCO and what it takes to achieve it.
- TCO Benefits
- Best Practices
- Deployment Tips
-
 A presentation slide deck from Rego University 2022. A course to improve your use of TBM Studio.
- References
- Managing builds
- Viewing your model and tracing data
- Using documentation options within TBM Studio
- Project Explorer Tricks
- Table Tricks
- Metric Tricks
-
 A presentation slide deck from Rego University 2022. This course taught an Agile approach to managing finances.
- IT Planning Essentials
- Common Practices & Challenges
- Leading IT Planning Approaches
- Continuous Planning vs Annual Planning
-
 A presentation slide deck from Rego University 2022. A class on building a defensible cost model.
- Characteristics of a defensible model
- Steps to build an accurate TBM model
- Allocation best practices
-
 A presentation slide deck from Rego University 2022. This class reviewed the importance of an application health check, optimization and tuning.
- Checking Apptio Version
- Tools Overview
- Configuration Tips
-
 A presentation slide deck from Rego University 2022. This course reviews the new release features in ApptioOne.
- Where to find new releases
- Apptio BI
- ApptioOne
- Editable Tables
-
 A presentation slide deck from Rego University 2022. An outline of topics used for a Apptio Round-Table discussion.
 -
 A presentation slide deck from Rego University 2022. This class reviewed Apptio reporting options, tips & tricks, etc.
- Introduction
- Reporting Options for Apptio
- Reporting Tips & Tricks
- Reporting best practices
- Custom Report Showcase
-
 A presentation slide deck from Rego University 2022. This deck reviews Apptio’s self-service reporting tool. This tool is geared towards end users and empowers them to create and share their own reports.
 -
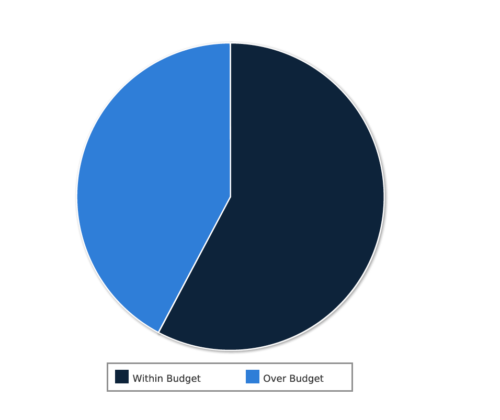 Project Cost within Budget report displays count of projects that are within or exceeding budget in the form of a pie chart. This report provides management a graphical representation of cost status on all projects. Mouse over on the pie chart displays count of projects for that category. You can further narrow your search by OBS Type & Path, Project Manager, Project Status, Project Stage, Program Name, Is project Active? And Is Template?.
 -
 Course description: “How does my financial forecast and budget (project/program/portfolio) relate to the department/cost center budgets that finance prepares? Is there a better way to link the two together? This is a topic many organizations struggle with, and this session will review tools and processes that can help solve this problem.”
 -
 Course Description: What is Technology Business Management (TBM) or IT Financial Management (ITFM)? Why is it important for IT? This session explores the need for TBM as well as how it drives significant cost optimization and more effective business-technology management practices. We will review the TBM framework, taxonomy, model, and how TBM processes and tools compliment your existing investment in PPM tools.
 -
 Course Description: Does your organization struggle to understand your fully burdened TCO for the applications that enable your business? Do you use spreadsheets and disparate data sources to manually calculate TCO? This session explores the data sources needed to calculate the fully burdened TCO for applications. We will also cover marketplace tools that allow you to track spending, providing trends of applications broken down by run and development costs.
 -
 Course Description: Does your IT organization struggle with IT budgeting and annual planning? Does your annual budget and planning process take months? This session explores leading approaches and purpose-built tools to shorten your budget cycle, align resources to business needs, and plan resources into future years while reducing errors and manual effort.
 -
 Course Description: The single biggest risk for CIOs and IT organizations today is not being able to make good spending decisions at the pace of digital business.
- Challenges
- Investment Planning
- IT Financial Management
- Agile Financials
- ServiceNow ITFM Capabilities
- Apptio Introduction
- ServiceNow / Apptio Solution
- Best Practices
- Pitfalls to Avoid
- Apptio Details


Copyright 2023 • Rego Consulting Corporation • Privacy Policy