-
 What should I expect to see within my organization related to PM over the next couple of years? How should I prepare my PMs, PMOs, or myself to embrace the new trends within the industry. This class will share Rego's observations on industry trends within PPM.
 -
 A presentation slide deck from Rego University 2022. Document reviews the 7 trends that Rego is seeing in the PPM space.
- Trend 1: Going Beyond Strategic Alignment
- Trend 2: Pivoting Quickly
- Trend 3: Value Scrutiny for PPM
- Trend 4: Hybrid Financial Management
- Trend 5: AI has the Buzz, Predictive Analytics has the Momentum
- Trend 6: Balanced Ecosystem of Tools
- Trend 7: Collaboration
-
 Actuals & ETC by Resource Assignment report provides project managers a single place to view Actuals and ETC associated with resources across multiple Tasks and Projects. It displays the following: Actual and ETC Hours by Start Date: Stacked Column chart that displays the total Actual hours and ETC hours per month of fiscal period. Grey color indicates Actuals and Purple indicates ETC hours during that month. Grid: Displays Investment name, Task, Assigned resource ETC and Actual hours per month of fiscal period. It also displays aggregated column and row totals for Actuals and ETC hours. You can further narrow your search by OBS Type, OBS Path & Start Date range.
 -
 Learn about the various techniques and emerging methods companies are taking to capitalize Agile work. You'll learn how some companies are moving away from timesheets and using models based on story points and team rates to generate capitalization reporting.
 -
 Learn about the various techniques and emerging methods companies are taking to capitalize Agile work. You'll learn how some companies are moving away from timesheets and using models based on story points and team rates to generate capitalization reporting.
 -
 Learn about the various techniques and emerging methods companies are taking to capitalize Agile work. You'll learn how some companies are moving away from timesheets and using models based on story points and team rates to generate capitalization reporting.
 -
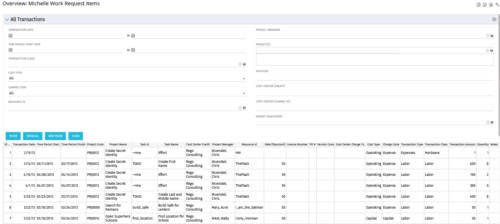 The All Transactions portlets have the capability to display any transaction within the system. Transactions from any type of investment can be viewed on this page. There are two version of this process:
- All Transactions (with security) – this will display rows only where the logged in resource has access to cost plans for projects or ideas. The portlet will check instance, OBS and global rights.
- All Transactions (without security) – will display all rows, regardless of cost plan access rights.
Column Label Description ID An unique identifier for each row displayed in the portlet. Transaction Date The data the transaction has been coded to. Time Period Start For transactions arising from timesheet entries, this will show the start period of the timesheet. Time Period Finish For transactions arising from timesheet entries, this will show the finish period of the timesheet. Project Code The ID of the investment. Project Name The name of the investment. Task ID The ID of the investment task where the actual cost has been assigned. Task Name The name of the investment task where the actual cost has been assigned. Cost Center Credit The department assigned to the resource where a cost needs to be credited. Project Manager The resource managing the investment. Resource ID The ID for the resource that has been assigned the cost. Rate (Standard) The rate for the cost. Invoice Number The invoice number. May come from a manual transaction or may be imported from a financial system integration. PO # The purchase order number. May come from a manual transaction or may be imported from a financial system integration. Vendor Code The vendor code that has been listed against the transaction. Cost Centre Charge To The department assigned to the resource where a cost needs to be charged. Cost Type Indicates whether the transaction is capital or operating. Charge Code The charge code assigned to the transaction as per the Clarity Charge Code list. Transaction Type Labour, Expense, Equipment or Material. Transaction Class The transaction class assigned to the transaction as per the Clarity transaction class list. Transaction Amount Rate x Quantity. Quantity The number of units. Notes Free text field for the transaction. -
 Annual planning shouldn’t be an Excel nightmare—or disconnected from strategy. In this session, see how one organization used Strategic Portfolio Management (SPM) with Clarity to transform their budgeting process from reactive to strategic.
 -
 A presentation slide deck from RegoU 2023. This course was a presentation by Apptio on their Product Roadmap.
 -
 Does your organization own Apptio or looking to purchase it? In this session we will dive into what Apptio is and how it complements your current Clarity solution.
 -
 Does your organization own Apptio or looking to purchase it? In this session we will dive into what Apptio is and how it complements your current Clarity solution.
 -
 Does your organization own Apptio or looking to purchase it? In this session we will dive into what Apptio is and how it complements your current Clarity solution.
 -
 Does your organization own Apptio, or are you looking into purchasing it? In this session, we will dive into what Apptio is and how it can complement your current Clarity solution.
 -
 A presentation slide deck from Rego University 2022. This document reviews how Clarity and Apptio can work together.
- Typical Challenges
- Apptio Introduction
- Clarity / Apptio Solution
- Rego’s BETA Integration
-
 A presentation slide deck from Rego University 2022. This deck reviews Apptio’s self-service reporting tool. This tool is geared towards end users and empowers them to create and share their own reports.
 -
 A presentation slide deck from Rego University 2022. This class reviewed Apptio reporting options, tips & tricks, etc.
- Introduction
- Reporting Options for Apptio
- Reporting Tips & Tricks
- Reporting best practices
- Custom Report Showcase
-
 A presentation slide deck from Rego University 2022. An outline of topics used for a Apptio Round-Table discussion.
 -
 This training document is a Rego Consulting Quick Reference Guide to assist with the creation of Benefit Plans in Clarity’s Modern User Experience. The document reviews the process to create a benefit plan and then add it to a cost plan.
 -
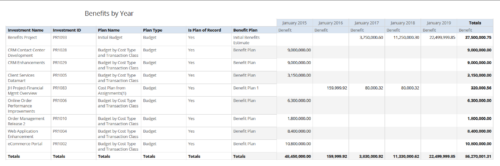
 The Benefits by Year portlet summarizes Benefit totals by year and is searchable by Project, OBS and Portfolio. The results display both Budgeted Benefit Plans and Forecast Plans and the associated Cost Plan. Users can make use of this portlet to view Benefit Plan totals across an OBS or Portfolio or to compare the Budgeted Benefit of a Project versus the current plan.
 -
The Benefits by Year portlet summarizes Benefit totals by year and is searchable by Project, OBS and Portfolio. The results display both Budgeted Benefit Plans and Forecast Plans and the associated Cost Plan. Users can make use of this portlet to view Benefit Plan totals across an OBS or Portfolio or to compare the Budgeted Benefit of a Project versus the current plan.
-
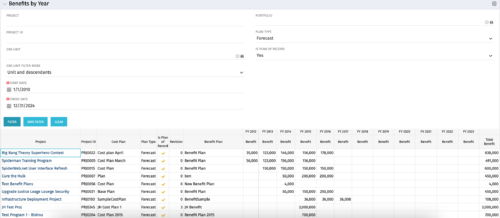
 Benefits by year report provides the project manager a single place to view Benefit plan and its associated benefit for various years across multiple projects. Project Managers can use this report to analyze if the projects are giving intended benefits and take appropriate decisions accordingly. User can further narrow their search by OBS Type & Path, Investment Name, Investment Manager, Investment Type, Plan Type and Is Plan of Record?.
 -
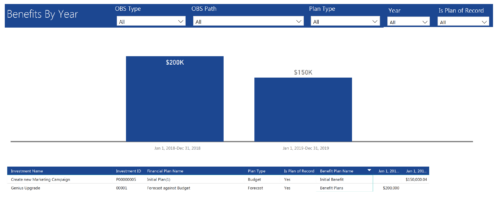 Benefits by year report provide the project manager a single place to view Benefit plan (Forecast /Budgeted) and its associated benefit for various years across multiple projects. Information is displayed in a bar graph and user can further drill down the details to investment level. Project Managers can use this report to analyze if the projects are giving intended benefits and take appropriate decisions accordingly. User can further narrow their search by OBS Type & Path, Plan Type (Budget/Forecast), Year and Is Plan of Record?.
 -
 A presentation slide deck from Rego University 2022. This course reviews the new release features in ApptioOne.
- Where to find new releases
- Apptio BI
- ApptioOne
- Editable Tables
-
 Do you want to understand the OOTB configuration and functionality of financial management? In this class, we will review the OOTB objects, views, views, and functions of financial plans, rates, and other related areas. We will cover both newUX gaps from classic. We will discuss best practices.
 -
 Do you want to understand the OOTB configuration and functionality of financial management? In this class, we will review the OOTB objects, views, views, and functions of financial plans, rates, and other related areas.
 -
 Do you want to understand Clarity's configuration and functionality for financial management? In this class, you will learn about the OOTB objects, views, and functions of financial plans, rates, and other related areas.
 -

A presentation slide deck from Rego University 2022. This document reviews the best practices for Financial Management in Clarity. - Involve the Finance Team
- Finance will drive financial classifications, resource rates, and capitalization rules
- Keep Things as Simple as Possible
- Streamline financial classifications in both the Estimation and Actuals processes
- Clarity is Not the Company’s Financial System of Record – it is a Project and Portfolio Management System
- Clarity may never match general ledger or project accounting module 100%
- Spend Time on the Full Architecture – Current and Future State
- Start With Required Outputs and Work Backward
- Integrate to Avoid Duplicate Entry
- Involve the Finance Team
-
 Value Stream Management (VSM) isn’t just another buzzword; it’s the visibility layer your digital transformation is starving for. In this session, learn how to map, measure, and maximize value across the entire delivery lifecycle.
 -
 Bar Chart displays average percent variance for all active projects by OBS unit. Percent variance = Planned Cost - Budgeted Cost / Budgeted Cost * 100. Projects with no Budgeted Cost are ignored for the calculation. Then all project variance percentages are algebraically added (some may be negative), and divided by total projects with a variance. This yields the Average Percent Variance. This calculation is performed for active projects in each OBS unit. OBS units include all units at all levels where projects are attached. Portlet filterable by OBS, Financial Status, and Financially Approved. Vertical axis = OBS Unit Name. Horizontal axis = Variance Percent. Data value = Average Percent Variance. Mouseover value = OBS Name + Average Variance Percent.
 -
Bar Chart displays average percent variance for all active projects by OBS unit. Percent variance = Planned Cost - Budgeted Cost / Budgeted Cost * 100. Projects with no Budgeted Cost are ignored for the calculation. Then all project variance percentages are algebraically added (some may be negative), and divided by total projects with a variance. This yields the Average Percent Variance. This calculation is performed for active projects in each OBS unit. OBS units include all units at all levels where projects are attached. Portlet filterable by OBS, Financial Status, and Financially Approved. Vertical axis = OBS Unit Name. Horizontal axis = Variance Percent. Data value = Average Percent Variance. Mouseover value = OBS Name + Average Variance Percent.
-
 This training document is a Rego Consulting Quick Reference Guide to assist with the creation of Budget Plans in Clarity’s Modern User Experience. The document reviews submission of a cost plan for approval, approving or rejecting submitted budgets and Budget Plan facts.
 -
 This portlet shows the variance between the budgeted cost and the planned cost for projects. This allows for the variance to be displayed between what was planned and what was approved. This provides the PMs with the ability to better plan the costs.
 -
This portlet shows the variance between the budgeted cost and the planned cost for projects. This allows for the variance to be displayed between what was planned and what was approved. This provides the PMs with the ability to better plan the costs.
-
This portlet shows the variance between the budgeted cost and the planned cost for projects. This allows for the variance to be displayed between what was planned and what was approved. This provides the PMs with the ability to better plan the costs.


Copyright 2023 • Rego Consulting Corporation • Privacy Policy