
- Group assignments
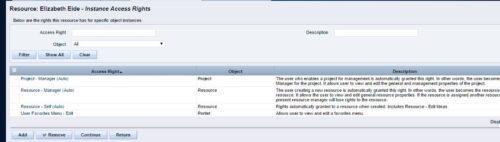
- Instance rights
- Global rights
-
 A process that removes all the group assignments for inactive users after execution of process. The following are removed for all inactive users:
 -
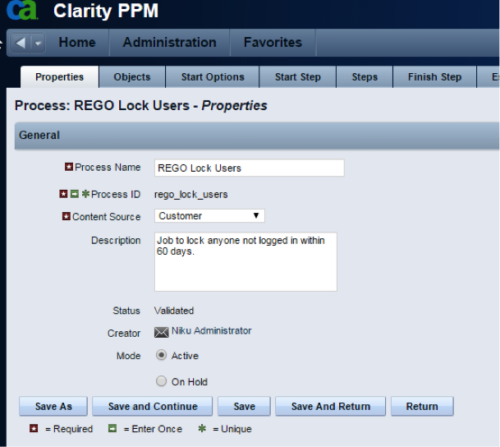 The Lock Inactive Users workflow process will automatically lock all user accounts when their last login date was more than 60 days ago. The process can be scheduled to run daily or can be run on demand when resource account cleanup is needed.
 -
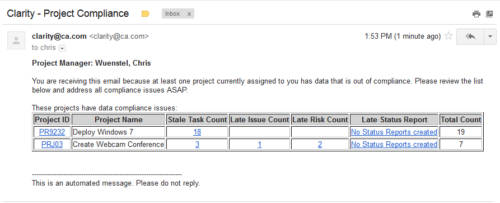 The Project Compliance Stalker – PM sends an email to Project Managers (and also their managers if so desired) at a set interval to alert them to project compliance issues. Areas of compliance that are reviewed include: stale project tasks (stale = past due date), late issues and risks (past due date) and late status reports.
 -
 The Unlock Projects workflow process can be run through the "Execute a Process" job. The workflow will execute a query that will automatically unlock projects that have been exported / checked out for over 2 days. This prevents any projects from remaining in the “locked” state for a long period of time, preventing time from posting to these projects.
 -
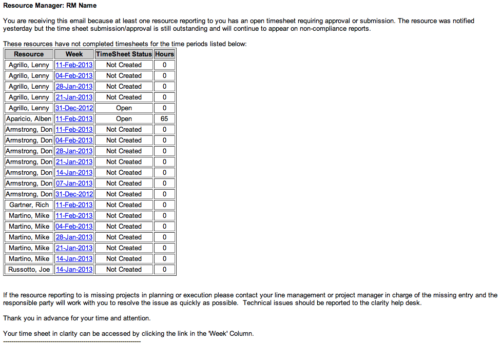 The Time Tracking Stalker - RM workflow process automatically sends an email to Resource Managers for each one of their resources that have not submitted their timesheet for a prior open time period, thus informing the RM if their resources are submitting their timesheets on time. Project Managers will also benefit since the notifications will help to ensure that time is being posted against their projects in a timely manner, helping to provide them with an accurate view of time expended on the projects.
 -
 The Self Assign workflow process updates a selected resource field on an object based on someone checking a boolean field on the same object. Using this process, whomever is editing the object, will be placed in this field automatically eliminating the need for each user to come in and update the field manually. The field will run when the Boolean is ticked and the user saves the page. It is important to note that the page will need to be reloaded to see the changes reflected. This can be used as a fast way to self-assign yourself to an object - you can create a boolean field that is checked and have the process assign you to that item.
 -
The Self Assign workflow process updates a selected resource field on an object based on someone checking a boolean field on the same object. Using this process, whomever is editing the object, will be placed in this field automatically eliminating the need for each user to come in and update the field manually. The field will run when the Boolean is ticked and the user saves the page. It is important to note that the page will need to be reloaded to see the changes reflected. This can be used as a fast way to self-assign yourself to an object - you can create a boolean field that is checked and have the process assign you to that item.
-
 The Scheduled Jobs Cleanup process removes all completed job instances that have run before a date set by the administrator. The administrator may use the gel parameter to update the amount of days since each job has run. Based on that date, the workflow will eliminate all jobs that have surpassed that threshold. This workflow helps administrators maintain the job logs and queue by eliminating jobs that users have potentially forgotten to remove on their own.
 -
The Scheduled Jobs Cleanup process removes all completed job instances that have run before a date set by the administrator. The administrator may use the gel parameter to update the amount of days since each job has run. Based on that date, the workflow will eliminate all jobs that have surpassed that threshold. This workflow helps administrators maintain the job logs and queue by eliminating jobs that users have potentially forgotten to remove on their own.
-
 The Give RM Calendar & Time Rights workflow process can be run through the "Execute a Process" job. The workflow will execute a query that gives a Resource Manager Calendar Edit and Timesheet Edit rights for their resources. These rights are not inherent for Resource Managers when they are named as an individual’s resource manager.
 -
The Give RM Calendar & Time Rights workflow process can be run through the "Execute a Process" job. The workflow will execute a query that gives a Resource Manager Calendar Edit and Timesheet Edit rights for their resources. These rights are not inherent for Resource Managers when they are named as an individual’s resource manager.
-
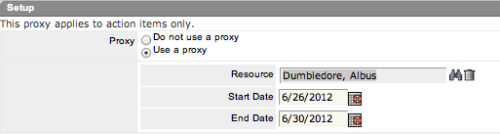 The Grant Approve Time to Proxy process utilizes the proxy feature within Clarity to assign timesheet approval and edit rights to a proxy for any resources that the user is the current resource manager for. The process, when run, will also remove any timesheet approval and edit rights for any users if the proxy has been removed or the resource manager has changed. This process is used for resource managers that will be out of the office.
