
- Overview
- Connecting to Data Sources
- Reports and Dashboards
- Creating a Report
- Data Import Options
- Data Transformation
-
 A presentation slide deck from Rego University 2022. The course outline for creation of Power BI Dashboards for Clarity, Beginner Level.
 -
 A presentation slide deck from Rego University 2022. The document reviews the best practices around annual planning for your Clarity instance.
- Introduction
- Annual Planning Basics
- Clarity in Annual Planning
- Investment Tracking
- Resource Planning
- Financial Tracking
- Prioritization
-
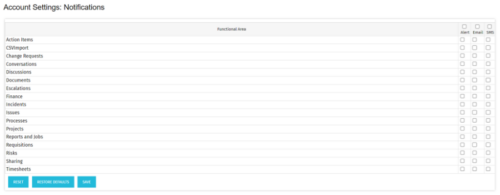 The Turn off Notifications process disables all Email, SMS and Alerts notifications for all users. This process is helpful if users would not like to receive emails from the system regarding actions items, timesheet submissions, etc. The script may be modified to include all users or all users that have been created within the last day.
 -
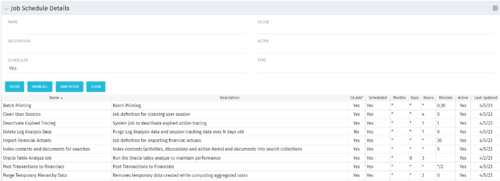 The Job Schedule Details portlet shows al jobs and displays all of the scheduled and non-scheduled information for those jobs – including the months, days, hours, and minutes. It also displays the last time the job was updated and whether or not the job was custom or a CA job. The portlet will help the administrator understand the current job schedule configuration. The table below describes the available columns in the portlet. The first 10 are configured in the default view:
Column Label Description Name Name of the Job Description Description of the Job CA Job? Whether this is CA Job? Yes or No Scheduled Scheduled Status of the Job. Yes or No Months Months the Job is scheduled to run Days Days the Job is scheduled to run Hours Hours the Job is scheduled to run Minutes Minutes the Job is scheduled to run Active Status of Job. Active or Inactive Last Updated Date the Job was Last Updated Code Unique internal Code of the Job Created By Name of Resource who created the Job Date Created Date the Job was created Executable Executable of the Job Job Code Unique Code of the Job Schedule Date Scheduled date of the Job run Type Type Updated By Name of Resource who updated the Job -

 The Capacity Graph portlet displays Availability, Allocations, Actuals and Assignments for one or more active resource(s) in a single view. This portlet pulls data from timeslices, and allows the user to filter on a weekly, monthly or quarterly data. The Estimated Time to Complete (ETC) and Allocation data will only show for projects that are active. This portlet provides Resource Managers, PMOs and Executives with a simple way to analyse: Allocations vs. Availability, Allocations vs. Actuals, Allocations vs. ETC and ETC vs. Availability. The graph allows the user to determine where areas of improvement may exist and quickly identify potential areas of constraint. Note: the information displayed is dependent on what the user has security rights to view.
 -
The Capacity Graph portlet displays Availability, Allocations, Actuals and Assignments for one or more active resource(s) in a single view. This portlet pulls data from timeslices, and allows the user to filter on a weekly, monthly or quarterly data. The Estimated Time to Complete (ETC) and Allocation data will only show for projects that are active. This portlet provides Resource Managers, PMOs and Executives with a simple way to analyse: Allocations vs. Availability, Allocations vs. Actuals, Allocations vs. ETC and ETC vs. Availability. The graph allows the user to determine where areas of improvement may exist and quickly identify potential areas of constraint. Note: the information displayed is dependent on what the user has security rights to view.
-
 Take a deep dive into Clarity's REST APIs. You will learn different ways to explore Clarity's API's using the REST API explorer, Postman, and Chrome's Developer Tools. We will cover HTTP methods, status codes, Clarity-specific headers, and creating and parsing JSON.
 -
 Want to keep your Clarity environment running efficiently? In this class we'll discuss how to maintain your Clarity environment through the use of jobs, processes, and configuration. We'll also cover recommended maintenance activities to ensure your environment is running optimally.
 -
 This class is a hands-on beginner training class on Clarity's native functionality for reporting. Learn how to build basic visuals/reports and leverage Canvas to get the most out of Clarity.
 -
 Clarity’s new reporting capabilities deliver interactive insights directly within the platform—no data exports required. In this session, you’ll learn how to harness the latest reporting features to empower decision-makers, visualize portfolio performance, and tell compelling stories with your data.
 -
 See how multiple Rego innovations can save time, reduce effort, and increase adoption across your organization. Leverage Power Automate to connect Clarity with SharePoint, Teams, and Outlook—automating tasks like creating Teams for projects, managing permissions, and sharing reports with non-Clarity users. Discover how the RegoLink PowerPoint add-in keeps decks up to date with templates and live Clarity data, and how the Excel Data Manager (EDM) simplifies bulk updates by letting you edit and validate data in Excel before syncing back.
 -
 The Rego PowerBI Reporting Suite features close to 100 free PowerBI reports, designed to enhance project management and reporting capabilities.
