-
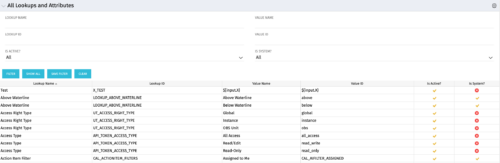 The All Lookups and Attributes portlet provides the ability to see all static lookups in the system, as well as their lookup values. Ability to filter and view the population by lookup name and ID, value name and ID, whether or not the item is active, and whether or not the item is a system (seeded) value. A system value is a record that comes with a base installation of Clarity as opposed to a value that was added manually or through a Clarity Add-in.
 -
 The All Risks portlet displays all risks related to active projects that the logged in user has view rights to access. The portlet provides the project manager a single place to view risks across multiple projects without having to go into each project individually, and allows for more efficient management and reporting across projects. The portlet displays Project ID, Project, Risk ID, Risk, Category, Assigned to, Status, Probability, Impact, Priority, Target Resolution Date, and Days opened. The filter allows narrowing down of the risks by several different criteria. Note: Only the projects that the user has viewer rights to see will show up in the list.
 -
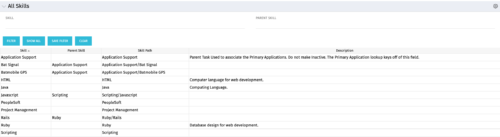 The All Skills portlet displays active skills available in the skills hierarchy, thus providing visibility to these values, without requiring administrative rights to be granted to the user. Viewing the skills list together in one view will allow the user to easily determine which skills they wish to add to their profile. The user may filter by Skill Name, or for skills associated with a particular parent skill.
 -
 The All Status Reports portlet displays any published Status Report related to a project or across multiple projects. The filter then allows the user to narrow their search by Project Manager, Project, Status or Overall Status Category (overall, cost & effort, scope or schedule). The user may also select if they wish to view only current Status Reports, or to include historical reports as well. The portlet provides the project manager a single place to view all of the status reports without having to go into each project individually, and allows for more efficient management and reporting across projects. Note: Only the projects that the user has view rights to will show up in the list.
 -
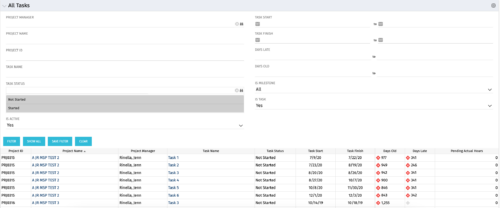 The All Tasks portlet displays all tasks related to active projects that the logged in user has view rights to. The portlet provides the project manager a single place to view tasks across multiple projects without having to go into each project individually, and allows for more efficient management and reporting across projects. The portlet displays project actuals and estimates from the project (datamart tables). The portlet allows analysis like:
- PMs may have several critical tasks that were supposed to start on a certain date. To verify progress, they filter for that start date to perform a review of the tasks.
- PMs can review days late to see how tasks are doing against the baseline date (<7 days is green, 7-14 is yellow, and >14 is red)
- PMs can review days old to see how tasks are doing against today’s date (<7 days is green, 7-14 is yellow, and >14 is red)
Column Label Description Project ID Unique project identifier Project Name Name of the project Project Manager Manager of the project Task Name Name of the task Task Status Not Started, Started, or Completed Task Start Start Date of this task Task Finish Finish Date of this task -
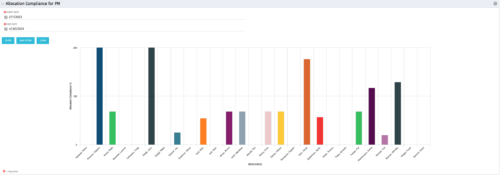
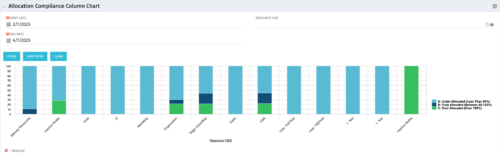 This view depicts Allocation Compliance for resources grouped by OBS. Using the daily Resource Availability and Daily Resource Allocation Time Slices this column chart groups aggregate Allocation vs Availability by OBS Unit. The chart allows quick analysis to see if resources are adequately allocated (between 80% to 120% of their capacity) or if they are significantly under or over allocated. NOTE: The grouping of OBS unit is limited to 1 level below the selected OBS in the portlet filter.
 -
 The Allocation Compliance by Person (Project Manager) portlet gives a view of resource allocation compliance for active resources on the team of an investment the logged in user is the manager for. It allows the PM to see resources on their project over the coming months and whether they are over or under allocated. This portlet leverages the daily allocation and daily availability slices as well as only active investments. The portlet provides filters for specific dates, filtering by resource ID, and resource name may also be added.
 -
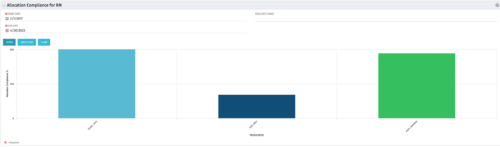 The Allocation Compliance by Resource (Resource Manager) portlet gives a view of resource allocation compliance for all active resources the logged in user is the Resource Manager for. It allows the RM to see resources they manage over the coming months and whether they are over or under allocated. This portlet leverages the daily allocation and daily availability slices as well as only active investments. The portlet provides filters for specific dates, filtering by resource ID, and resource name may also be added.
 -
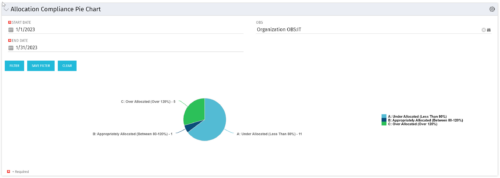 The Allocation Compliance Pie Chart portlet gives a view of active resources' allocation compliance within a date range and OBS displayed in a pie chart. It allows the user to the percentage of resources over, under, and adequately staffed on projects over a selected time period. This portlet leverages the daily allocation and daily availability slices as well as only active investments. The portlet provides filters for specific dates (required) and OBS.
 -
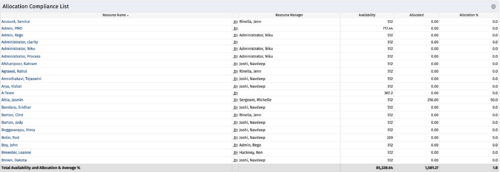
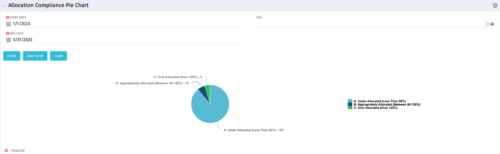
This Allocation Compliance Drilldown Enhancement portlet is used in conjunction with the Allocation Compliance Pie Chart. Once the user selects a specific section of the chart, the Allocation Compliance Drilldown Enhancement will display a list of resources fulfilling that selection. The Allocation Compliance list portlet shows the Resource Name, the Resource Manager, Availability, Allocated Hours and Allocation % for the selection. Note: The Allocation compliance pie chart is displayed first based on the filter selection i.e., Start Date, End Date and OBS. The pie chart is displayed as per the following three slices of the pie: Under Allocated (Less than 80%) Appropriately Allocated (Between 80-120%) Over Allocated (Above 120%) The slice of a pie can be clicked to display resource allocation compliance information in the Allocation Compliance List portlet, as described earlier. The table below describes the available columns in the Allocation Compliance list portlet. The first 5 are configured in the default view: Column Label Description Resource Name Name of the Resource Resource Manager Resource Manager Availability Resource Availability Allocated Resource Allocation Allocation % Resource Allocation % Res_id Unique identifier of the Resource -
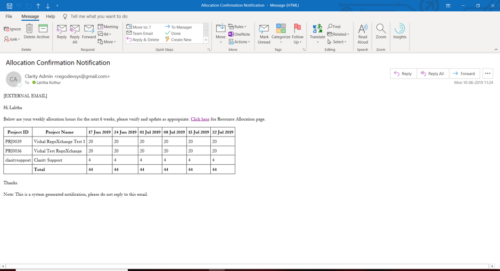 A Process run via Execute a Process job; sends an email to active resources, containing a facsimile of their Resource Allocation Detail page. It shows the next six weeks of allocations by investment, with a column total. The email also contains a click here link to this page in CA PPM, to enable editing of the data, as appropriate.
 -

This portlet displays the monthly allocation per resource. The PM can view by the RM or the resource to get the data for monthly resource allocations. The table below describes the available filter fields in the portlet. Column Label Description Work Effort Manager Manager of the Investment the Work Effort is on Work Effort Active Active status of the Investment the Work Effort is on Resource Resource’s Name Internal Resource ID Resource’s ID Zero Allocation Show Allocations that equal zero Open for Time Entry Is the Resource Open for Time Entry Resource Active Resource’s Active status Role Resource’s Primary Role OBS Unit Resource’s OBS Start Allocation Start Time to filter by End Allocation Finish time to filter by


Copyright 2023 • Rego Consulting Corporation • Privacy Policy