| Installation files are not provided with the download. While the MUX Migration Tool is free, it does require some time by Rego Technical Staff to install. Approximately 4 hours is required. If you are current Rego Customer, this time can be applied against a current project if you choose, or against an Ad Hoc SOW/PO you have in place with us. Please reach out to your friendly Rego Account Director to arrange to have the tool installed. Installation files are not provided with this download. They will be installed by our staff.
If you are currently not a Rego client, we invite you to reach out to us at info@regoconsulting.com and we can arrange to set up an Ad Hoc bucket of hours for this install and any future work we can do for you. |
*Note: MUX Migrator v2.0 will only work on Clarity versions 16.1.0 and higher.
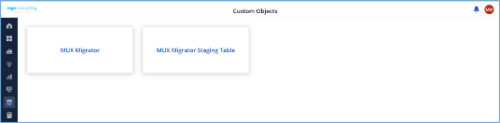
The Migration Tool for Modern UX Components provides the ability to migrate Blueprints, Views, and Field Level Security between environments. Previously, the promotion of these components needed to be done manually. This functionality, to be utilized by an administrator, is available under the Custom Objects Area of Clarity.
Source to Target Approach
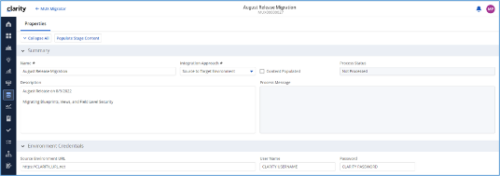
The user would first create an ‘MUX Migrator’ instance and populate the associated details. Once ready, they will use the “Populate Stage Content” action which will run a workflow in the background to populate a Staging Table with Source Environments content. (Blueprints, Views, and Field Level Security)
After a successful populate, they would navigate to the “MUX Configuration” module where they can decide on what content they want to migrate between environments. They can select one to many components they wish to migrate.
Once the “MUX Configuration” sub-object is populated, the user can navigate back to the “Properties” module. Once a password is populated, the user can use the Actions drop-down to run the “Migrate Content to Environment” workflow. This will run a process that will migrate the content from the source environment to the target environment.
JSON Approach
The user would first create an ‘MUX Migrator’ instance and populate the associated details. They would navigate to the “MUX Configuration” module where they can decide on what content they want to migrate between environments. They can select one to many components they wish to migrate.
Once the “MUX Configuration” sub-object is populated, the user can navigate back to the “Properties” module. The user can use the Actions drop-down to run the “Export JSON” workflow. This will run a process that will generate a .txt file located in the “JSON File” attribute. That file can be downloaded from the Source Environment. The user can then login to the Target Environment. The user would first create an ‘MUX Migrator’ instance and populate the associated details. Once the ‘MUX Migrator’ instance is created, they can upload the JSON File that was downloaded from the Source Environment. The user can use the Actions drop-down to run the “Import JSON” workflow. This will run a process that will generate read the file located in the “JSON File” attribute and load the configuration into the Target Environment.
View Administration
The user would first create an ‘MUX Migrator’ instance and populate the associated details. They would navigate to the “MUX View Administration” module where they can decide on what views they would like to update the creator of. They can also reset the “default” view displayed when logged in for a resource(s), Security Group(s), or Resource OBS Node(s).
Prerequisites
- The user will create the migrator instances/run the processes in the Target Environment they wish to migrate content to (E.g., Run this in PROD to migrate the content from a lower environment to PROD)
- Any attributes that are part of the Blueprints, Views, or Field Level Security must exist in the target environment.
- The user that is utilizing the content must have the following security rights associated to their account.
- XOG rights to all the associated objects
- View/edit security rights to the MUX Migrator Object and MUX Migrator Content Object
- oView rights to the MUX Migrator Staging Table Object
- API-Access
- Process Start or Process AutoStart – All
|
|

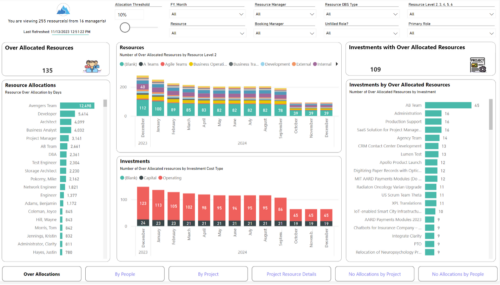 Evaluate resource allocations, identify bottlenecks, and ensure optimal resource utilization across projects and teams. Report Views include: • Over Allocation • By Project • By People • Project Resource Details • No Allocations by Project • No Allocations by People The main file will access data through custom queries created via Rego Odata connector.
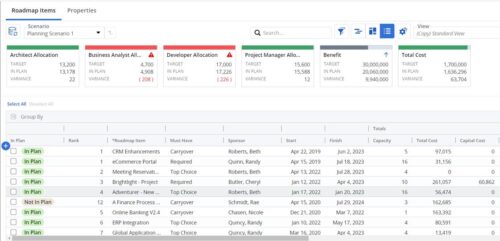 This Roadmap add-on provides configurable Role-based metrics that can be used in the grid view as targets and constraints. Select your valuable roles in the “targets” and once selected, the “sync” button will bring in any current allocations against projects and allow editing any of the total numbers directly in a scenario. This will provide deeper insights into impacts of plans on teams/resources in addition to the out of the box money and time constraints.
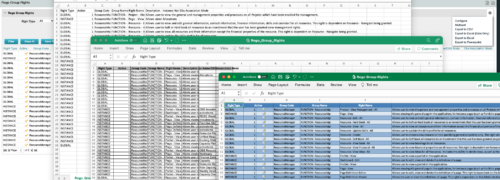
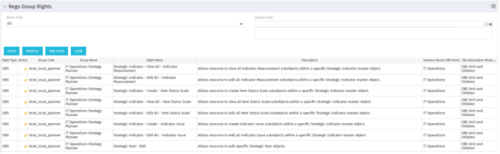 The Rego Group Rights portlet is a useful list view for functional administrators. It provides a flat view of all the Global, OBS and Instance rights that have been granted to all the groups in Clarity. It can be further filtered by just the rights type and/or the security group. It is also possible to export out to file in spreadsheet (csv, xlsx) or PowerPoint formats with OOB Clarity functionality.
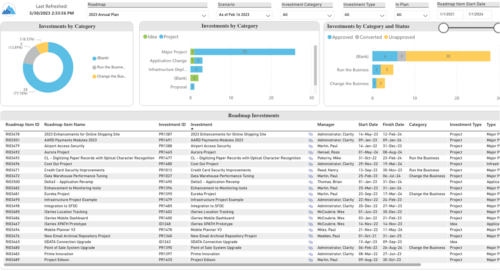 Plan your future work by comparing different scenarios, including in-flight work, and determine the best course of action for your organization. Report Views include: • Roadmap Details • Resource Investment Demand • Roadmap Financials • Roadmap Investment Gantt • Roadmap Item Gantt • Roadmap Overview – Default Scenarios • Roadmap Overview – Single Roadmap Selection • Scenario Comparison Demo Video - https://www.youtube.com/watch?v=RjdvrRd4ZG0&list=PLXJ5ktuWV0jiS9CvBpHvBIwpKPmA9uvwK&index=7
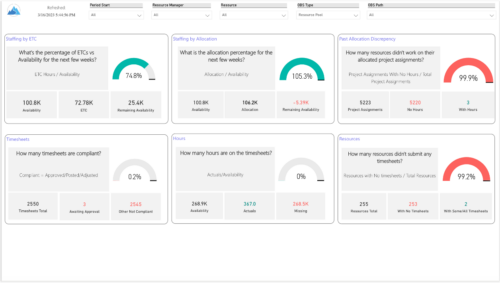 Evaluate resource allocations, identify bottlenecks, and ensure optimal resource utilization across projects and teams. Report Views include: • Allocation Discrepancies • Resource Detail • Resource Skills • Resource Summary • Resource Tasks • Staffing Allocations • Staffing ETC Demo Video - https://www.youtube.com/watch?v=0Rzwl1-jbck&list=PLXJ5ktuWV0jiS9CvBpHvBIwpKPmA9uvwK&index=6
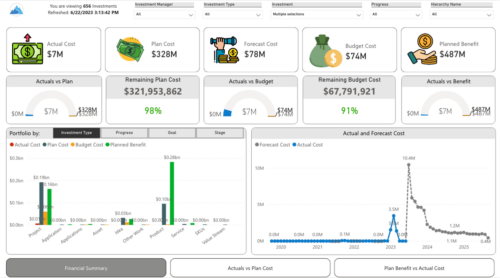
 Gain a financial view of your investments by comparing actuals to planned cost and planned benefit. Report views include: • Financial Summary • Planned Benefit vs Actual Cost • Actuals vs Planned Costs Demo Video - https://www.youtube.com/watch?v=uyDSbbgG1O8&list=PLXJ5ktuWV0jiS9CvBpHvBIwpKPmA9uvwK&index=2
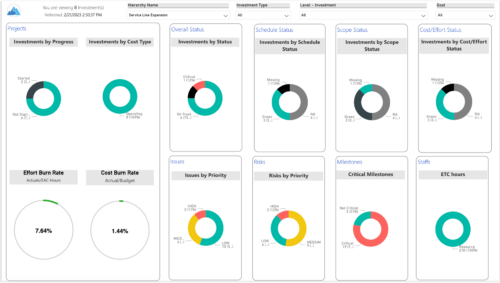
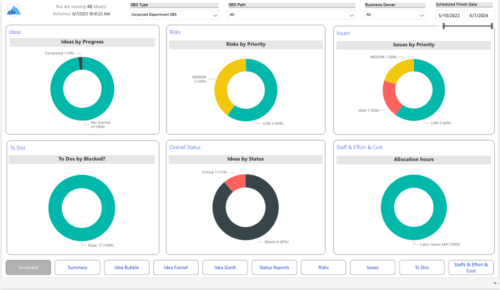 Master your pipeline as you prioritize, visualize, and analyze ideas, assess their feasibility, and track progress from inception to execution. Report Views include: • Idea Bubble • Idea Details • Idea Funnel • Idea Gantt • Idea Overview • Idea Staff and Effort • Idea Status • Idea To Dos Demo Video - https://www.youtube.com/watch?v=xPSxOlrqEq8&list=PLXJ5ktuWV0jiS9CvBpHvBIwpKPmA9uvwK&index=3 The main .rpt file will access data through the Data Warehouse. For clients on Rego’s AWS hosting, we have versions that work with Oracle and Postgres DB and access the live database, if the Rego Odata connector is being used.
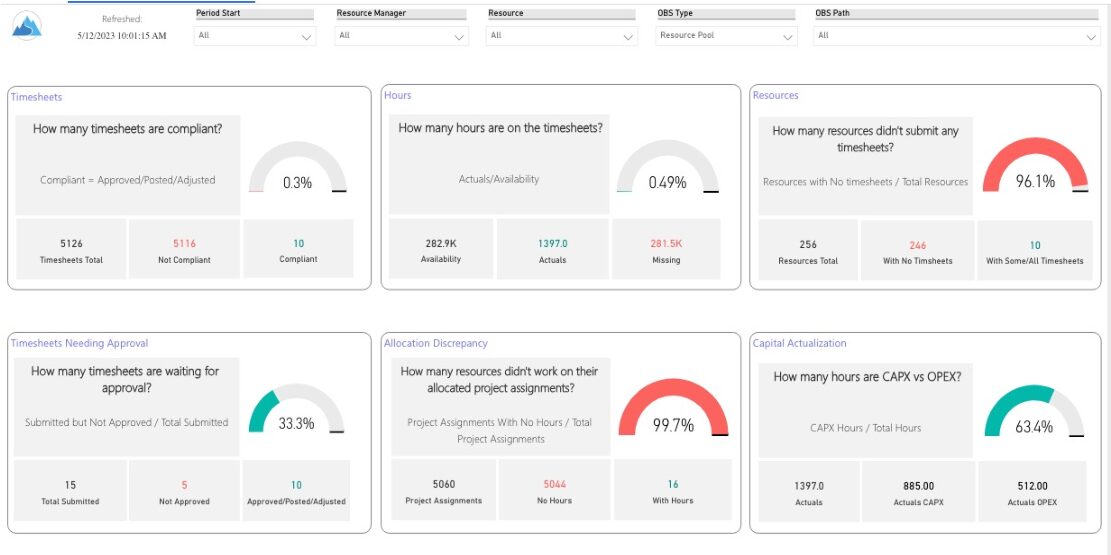

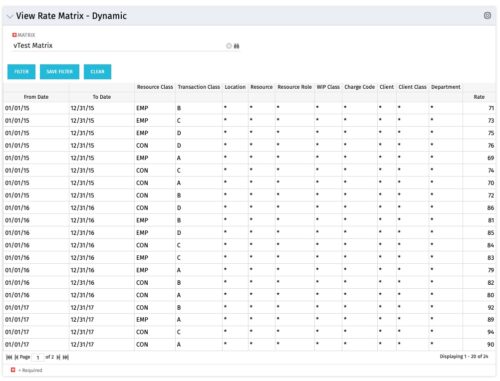 View Rate Matrix is a grid portlet that provides users a single place to view all the rates defined across multiple rate matrix without going to administration tab. Each Matrix may be defined with different columns (ex: Charge Code, Client, Department, Entity, Input type Code etc). This portlet dynamically brings only the columns associated with that rate matrix and provides the detailed information. User can view information related to one matrix at a time.