
|
-
-
 This workflow is run as a scheduled or immediate Job to populate Project Cost Plans. It can be configured to run on any desired set of projects. It can be configured to populate the Cost Plan of Record based on Allocations or based on Assignments.
 -
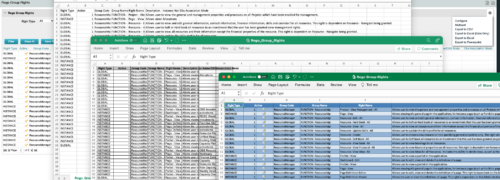
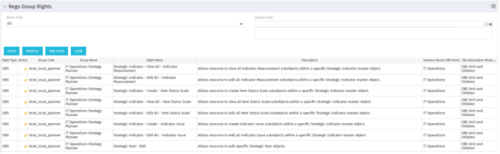 The Rego Group Rights portlet is a useful list view for functional administrators. It provides a flat view of all the Global, OBS and Instance rights that have been granted to all the groups in Clarity. It can be further filtered by just the rights type and/or the security group. It is also possible to export out to file in spreadsheet (csv, xlsx) or PowerPoint formats with OOB Clarity functionality.
 -
 The Status Report Publish workflow process pushes values from the status report sub-object to the parent project object. The process is started when the user ticks the “Publish” Boolean field on the status report (custom field added). This workflow will update the project object with the overall status indicator, the status comment, the previous overall status, and the as of date. This eliminates the project manager having to update the fields in both the status report and the project overall.
 -
 The Communications Portlet - Simple portlet provides a simple mechanism to communicate with Clarity users. The content of the porlet can be edited easily through the Portlet administration screens within Clarity. This is a very beneficial method of delivering messages to your Clarity users all at the same time.
 -
 An HTML portlet that displays two buttons that link the user instantly to an object create page. The portlet comes with two buttons and the buttons can be modified to link to any creation page. Administrator can choose: Project, Idea, Application, Program, etc.
 -
 The Clarity Health portlet provides a quick glance into the health of key components and critical jobs in the Clarity environment. The following metrics are monitored: Process Engine Heartbeat should refresh itself every 10 minutes. Process Engine is responsible for the triggering of processes. Green <= 10 Minutes, Yellow 11-15 Minutes, Red > 15 Minutes Time Slices Time Slices are required for accurate reporting. Best practice is for the Time Slicing job to run every minute. Please note there are some jobs that will cause the time slicing to delay so a momentary delay is normal. Green <= 10 Minutes, Yellow 11-15 Minutes, Red > 15 Minutes Datamart Extraction Green <= 24 Hours, Yellow 24-48 hours, Red > 48 hours Datamart Rollup Green <= 24 Hours, Yellow 24-48 hours, Red > 48 hours Rate Matrix - Full Best practice is to run a full rate matrix nightly Green <= 24 Hours, Yellow 24-48 hours, Red > 48 hours Rate Matrix - Incremental Green <= 24 Hours, Yellow 24-48 hours, Red > 48 hours Load Data Warehouse - Full Load Green <= 24 Hours, Yellow 24-48 hours, Red > 48 hours Load Data Warehouse - Incremental Green <= 24 Hours, Yellow 24-48 hours, Red > 48 hours Load Data Warehouse Access Rights Green <= 24 Hours, Yellow 24-48 hours, Red > 48 hours The Clarity Health portlet provides a quick glance into the health of key components and critical jobs in the Clarity environment. The following metrics are monitored: Process Engine Heartbeat should refresh itself every 10 minutes. Process Engine is responsible for the triggering of processes. Green <= 10 Minutes, Yellow 11-15 Minutes, Red > 15 Minutes Time Slices Time Slices are required for accurate reporting. Best practice is for the Time Slicing job to run every minute. Please note there are some jobs that will cause the time slicing to delay so a momentary delay is normal. Green <= 10 Minutes, Yellow 11-15 Minutes, Red > 15 Minutes Datamart Extraction Green <= 24 Hours, Yellow 24-48 hours, Red > 48 hours Datamart Rollup Green <= 24 Hours, Yellow 24-48 hours, Red > 48 hours Rate Matrix - Full Best practice is to run a full rate matrix nightly Green <= 24 Hours, Yellow 24-48 hours, Red > 48 hours Rate Matrix - Incremental Green <= 24 Hours, Yellow 24-48 hours, Red > 48 hours Load Data Warehouse - Full Load Green <= 24 Hours, Yellow 24-48 hours, Red > 48 hours Load Data Warehouse - Incremental Green <= 24 Hours, Yellow 24-48 hours, Red > 48 hours Load Data Warehouse Access Rights Green <= 24 Hours, Yellow 24-48 hours, Red > 48 hours
 -

Rego’s Clarity Adoption Metrics package consists of two sets of metrics: Project metrics, and Resource metrics. Project metrics measure how effectively project managers are using Clarity to manage their projects. Resource metrics measure how effectively resource managers are using Clarity to manage resources. Metrics are scored on a scale of 0 to 5, with higher scores indicating greater adoption and use. All metrics can be viewed numerically or graphically, and can be broken out by OBS. In addition, metric data can display as a 12-month rolling history to help identify trends. Project metrics can also display by lowest / highest adoption rates for a specific resource metric or all resource metrics. There is a variety of way to view the Adoption Metric data, therefore, Rego has made this simple by creating an Adoption Metrics object that contains multiple tabs. Each tab displays one or more of the Project or Resource Adoption Metrics. Based on the nature of the Metrics some tabs will allow the ability to use a pull down menu to select a specific Adoption Metric. There is also a Metrics trending view that pulls monthly snapshots of the metrics. Project metrics consist of the following: - Project Status Reporting – Measures how well PMs create and publish project status reports.
- Project Risk Adoption – Measures how well Risks are being used and managed.
- Project Issue Adoption – Measures how well Issues are being used and managed.
- Project Schedule – Measures how well PMs create tasks and keep the project schedule current.
- Project Baseline – Measures whether or not baselines exist.
- Project Zero ETC’s – Measures how well the PM assigns resources to tasks with ETCs.
- Project Past ETC’s – Measures how many improperly scheduled tasks the PM has.
- Project Milestone / Key Tasks – Measures how well PMs create and manage Milestones / Key Tasks.
- Project Schedule Variance – Measures how effectively PMs manage their schedules.
- Project Effort Variance – Measures how effectively PMs manage their project efforts.
- Project Budget Variance – Measures how effectively PMs manage budgets or cost plans.
- Project Unfilled Roles – Measures project roles with allocations that are already started or starting within the next 30 days.
- Project Data Quality – Measures how effectively PMs complete the Description, Stage, Progress, Objective, and Sponsor/Business Owner fields.
- Project Commitment – Measures the hard allocations for a project over a two week time frame.
- Resource Clarity Usage – Measures how often users log into Clarity.
- Resource Timesheet – Measures if timesheets post in a timely manner.
- Resource Allocation – Measures how well RMs keep total resource allocations within the expected range for future time periods.
- Resource Actualy Utilization – Measures how well Resource allocations match actuals.
- Resource Allocation Date in the Past – Measures how many resources are open for time entry with dates in the past.
- Resource Data Quality – Measures how well RMs complete the Resource Manager and Primary Role fields and optionally the Skill and Employment Type fields.
- Resource Commitment – Measures how much resource available time is committed to projects.
-

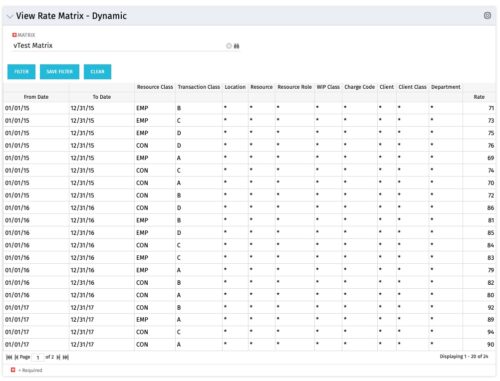 View Rate Matrix is a grid portlet that provides users a single place to view all the rates defined across multiple rate matrix without going to administration tab. Each Matrix may be defined with different columns (ex: Charge Code, Client, Department, Entity, Input type Code etc). This portlet dynamically brings only the columns associated with that rate matrix and provides the detailed information. User can view information related to one matrix at a time.
 -
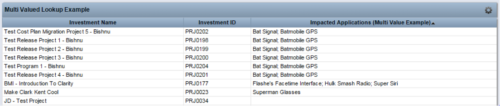 The Concatenate Multi-Value Lookup into One Field for Display Purposes technical trick provides an overview of how to group or concatenate the various levels and values of a Multi-Value lookup into one field in both Oracle and SQL Server environments. This allows the lookup values to be more easily displayed in a portlet. The function concatenates the values together using a choice of delimiter, which then allows the multi-value lookup to be viewed as one portlet column, in the same manner as any other object attribute.
 -
 This solution provides an administrator the ability to log into the CA Clarity application as any user in the system. This ability is especially helpful when troubleshooting user issues and security settings. (Will not work with On-Demand Instances.)
 -
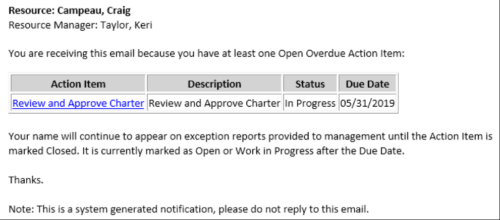 This Process sends an email to every Action Item Assignee where the Due Date/Time has passed and the Status is either Open, or In Progress. Users may want to modify this stalker to include Status = Deferred. In addition, the Resource Manager for the Assignee receives a copy of the email. In order to generate emails, the SMTP gateway must be up and running and Resources must have a valid email address.
