-
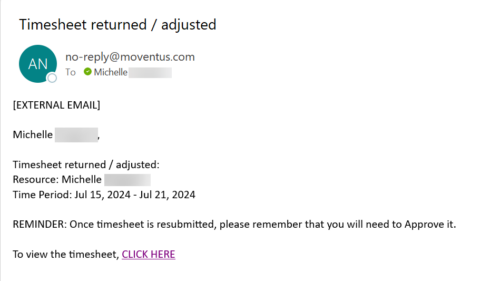 The Adjusted Timesheet Stalker process is designed to be run via a scheduled job. The end user will need to set up the job and can choose the frequency at which this job should be run. The process will search the system for timesheets with a status of ‘Adjusted’. An email is sent to the resource manager for any resources identified as having adjusted timesheets. The email will provide: • Name of resource • Time period The resource manager is advised that once the timesheet is resubmitted, they will need to approve it. A link to the timesheet itself is provided in the body of the email.
 -

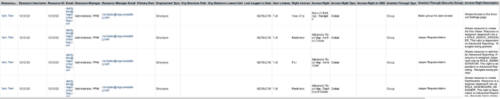 This Portlet can be used to define User License Output information including the following:
- Resource
- Resource User Name
- Resource Id
- Resource Manager
- Resource Manager Email
- Primary Role
- Employment Type
- Org Structure Path
- Org Structure Lowest Unit
- Last Logged in Date
- User License
- Right License
- Access Right
- Access Right Type
- Access Right to OBS
- Granted Through Type
- Granted Through (Security Group)
- Access Right Description
- Resource OBS
- Resource
- Resource Manager
- Primary Role
- Employment Type
-
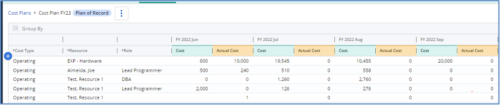
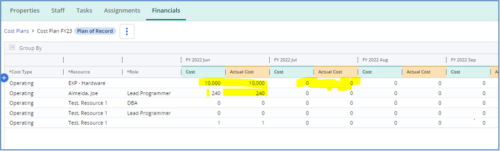 The Populate Prior Periods Forecast From Actuals in Cost Plans process updates Cost Plans for Active Projects, it updates the Forecast for previous months = Posted Actuals, to remove variances from past periods. This is an On Demand process in Clarity named Populate Prior Periods Forecast From Actuals in Cost Plans and can be manually executed from the Organizer or scheduled through the “Execute a Process” job. If there are number of processes in the Organizer – Available Processes, this process can be filtered and then checked to Start. When the process is started it will be seen in the Initiated on the Processes tab. The process status can be monitored from Running to the Completed stage. The process is very flexible and supports Cost Plans with any given grouping and it also works without any dependency on timeslices or other jobs. The process fetches Cost plan of records for all active projects in the system that have Actuals transactions in WIP table. It then process those cost plans to update all of the prior monthly forecast periods with the corresponding monthly Actuals.
 -
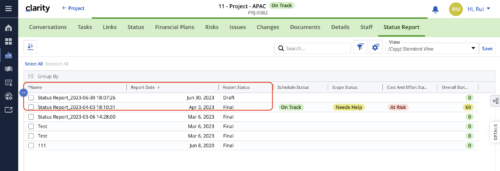 When marking a Status Report 'Final' in a grid/list view, the system doesn't create a new 'Draft' report like it does when using the Status Report UI. For groups that prefer to manage in a grid/list, they need to always have a draft.
 -
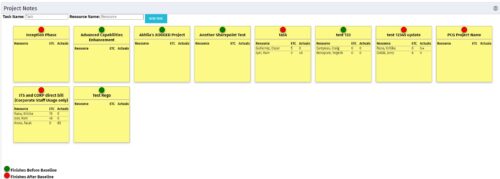 The Task-At-A-Glance Notes portlet provides a view of project tasks and assignments in an easy to read format, similar to popular sticky – note applications. This portlet will display all tasks on a project, ‘pinning’ them to a dashboard. Each task will include the resources assigned to them, as well as the ETCs left for the resource, and the actuals that they have posted. Each sticky note allows you to link to the task details, as well as the resource assignment details. In addition to important assignment detail, each pin on the individual task’s note indicates if the task finishes before the baseline (green), or if it is going to finish after the baseline (red).
 -
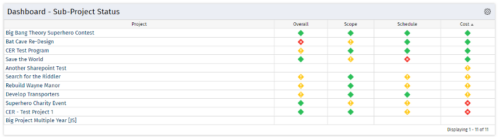 The Program Dashboard Sub-Project Status portlet gives the ability to view the most recent status report for all sub-projects on a program. The portlet will pull the "id" from the page it is placed on, so this portlet is usually placed on the dashboard tab. This portlet displays each sub-project, type of status, and the symbol related to the severity.
 -
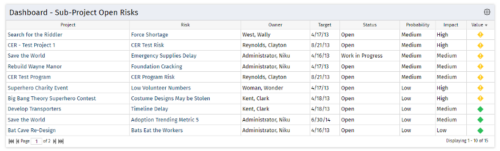 The Program Dashboard Sub-Project Open Risks portlet gives the ability to view all risks on the sub-projects of a program that are not closed or resolved. The portlet will pull the "id" from the page it is placed on, so this portlet is usually placed on the dashboard tab. The portlet sorts the issues first by value, in descending order, and then by target date. It displays the sub-project name, risk name, owner, target date, status, probability, impact and value.
 -
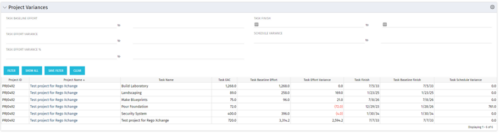 This Project Variances portlet provides a project manager a consolidated view of all of their active projects and open project tasks and shows them the baseline variance for the task EAC’s and the task start and finish dates. This gives the project manager a single place to view and manage how their projects are progressing against their baselines. The PM can easily detect when projects are running behind and pinpoint which tasks are causing the variance in the schedule.
 -
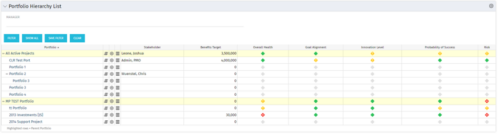 Part of the Business Transformation Package, this portlet displays the portfolios with hierarchy (child portfolio(s)). The portlet displays the basic portfolio fields like – manager, stakeholder, etc. A Metrics subpage can be created with the fields on the “Properties – Metrics.”. The fields: Overall Health, Goal Alignment, Innovation Level, Probability of Success are custom fields and can be configured on a subpage.
 -
 This portlet shows the project costs by Month. The information displayed includes:
- Start Date for project
- End Date for project
- Budgeted Cost
- Planned Cost
- Actual Hours
-
 Part of the Business Transformation collection, this pie chart portlet displays realized benefit, grouped by category for portfolio investments. It uses System Provider: Portfolio Investment Provider.
 -
 This configuration and accompanying process allows users to capture Financial and Non-Financial (Metrics, Soft, etc.) Benefit in a custom sub-object, then programmatically create an out-of-the-box Benefit Plan with just the Financial Portion from the custom sub-object. The solution is comprised of:
- Sub-Object (Benefit Plan Details, Parent = Project)
- Process: Create Benefit Plan (uses sub-object as primary input, native BP is output)
- Process: Update sql - Cost Benefit Plans (one-time script to update Projects)
- Ensure on the Benefit Details List view the Planned and Realized Amounts are displayed
- Modifying the Create Benefit Plan Process in support of a BP naming convention consistent with local PMO Practices
- Modifying the Create Benefit Plan Process to link the BP to the Cost Plan of Record
- Creating a Portlet that pulls together rows of data from the sub-object across multiple projects in a summarized view as well as a detailed view


Copyright 2023 • Rego Consulting Corporation • Privacy Policy