
- OBS Type
- If the project is financially approved?
- Financial Status
-
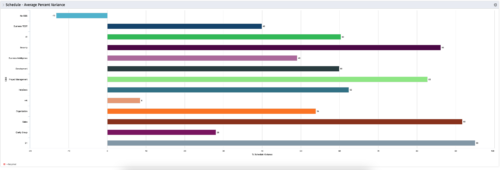 This is a graphic portlet that pulls the average schedule variance by OBS node of the project. The portlet allows you to choose any OBS that is associated to the Project Object. Users can filter by:
 -
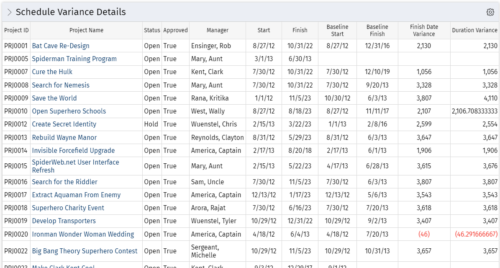 This portlet shows the variance between the schedule finish and baseline finish for projects. The portlet also displays the schedule variance: {(Finish-Start) – (Baseline Finish-Baseline Start)}.
 -
 The Scheduled Jobs Cleanup process removes all completed job instances that have run before a date set by the administrator. The administrator may use the gel parameter to update the amount of days since each job has run. Based on that date, the workflow will eliminate all jobs that have surpassed that threshold. This workflow helps administrators maintain the job logs and queue by eliminating jobs that users have potentially forgotten to remove on their own.
 -
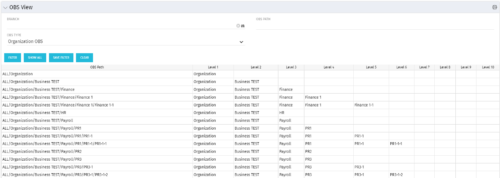 This grid portlet shows the OBS name and ID along with the associated hierarchy, both as an aggregated view along with each of the levels broken out. The table below describes the available filter fields in the portlet.
Column Label Description Branch Branch of the OBS OBS Type OBS to use OBS Path Path of the OBS -
 The Status Report Publish workflow process pushes values from the status report sub-object to the parent project object. The process is started when the user ticks the “Publish” Boolean field on the status report (custom field added). This workflow will update the project object with the overall status indicator, the status comment, the previous overall status, and the as of date. This eliminates the project manager having to update the fields in both the status report and the project overall.
 -
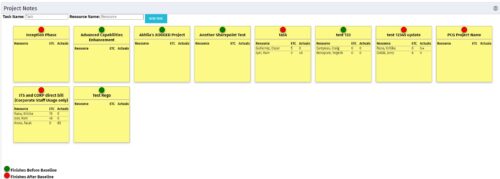 The Task-At-A-Glance Notes portlet provides a view of project tasks and assignments in an easy to read format, similar to popular sticky – note applications. This portlet will display all tasks on a project, ‘pinning’ them to a dashboard. Each task will include the resources assigned to them, as well as the ETCs left for the resource, and the actuals that they have posted. Each sticky note allows you to link to the task details, as well as the resource assignment details. In addition to important assignment detail, each pin on the individual task’s note indicates if the task finishes before the baseline (green), or if it is going to finish after the baseline (red).
 -
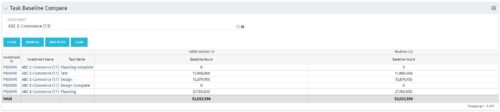 The Task Baseline Compare portlet displays the tasks in a specific Investment and provides the ability to compare the baseline hours for the tasks in each version of the baseline.
 -
 When a task is marked as complete the process looks to any tasks that are dependent on the newly completed task. If a task is marked as “Not Started” and all of the dependency tasks are marked as complete then the process will change the task status to “Started” and email all resources that are assigned to the task that has started. The process notifies resources that a task is ready to start and saves the project manager the manual effort of updating dependent tasks. NOTE: The process relies on task dependencies and is most useful in those environments where task dependencies are managed.
 -
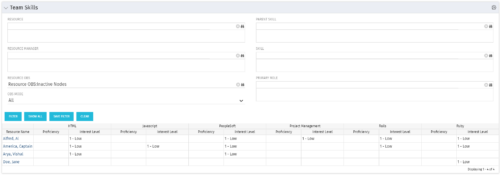 The Team Skills portlet displays Skill Proficiency and Interest Level by Resource. Users can utilize this view to search for Resources by Skill, Parent Skill, Interest, Role, Parent Role, Resource and Resource OBS. This portlet grants a Project Manager or Resource Manager the ability to determine which Resources best fit the needs for their project.
 -
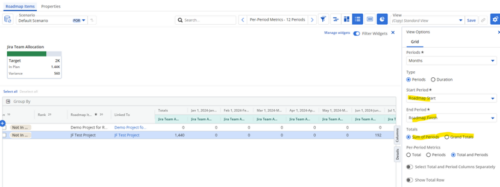
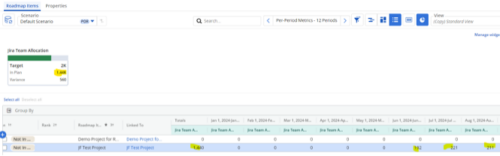 Capture and present allocation data by Team for the Investments included in your Roadmap to enable the ability to compare to Targets or Limits. Allocation data can be presented in Hours or FTE, for Teams Only.
 -
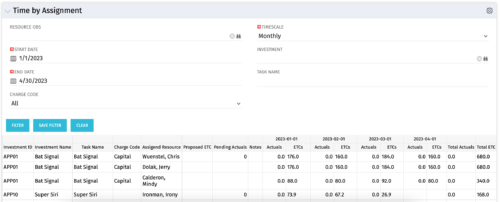 The Time by Assignment portlet displays time logged to assignments for all investments the logged in user has security rights to view - pulling data from the timeslices. It is capable of displaying the data by weekly, monthly or quarterly segments. The portlet may also be filtered by investment and resource OBS.
 -
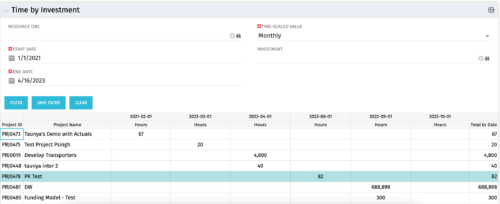 The Time by Investment portlet displays time logged to investments for all investments the logged in user has security rights to view using data from timeslices. It is capable of displaying the data by annual, quarterly, monthly, weekly, and daily segments with totals per date also being presented. The portlet may can be filtered by investment, resource OBS, and time segments. This portlet can be used as a management and governance tool to review aggregate hours posted to investments by time period.
