-
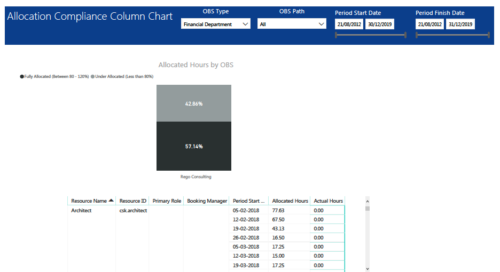 Allocation Compliance Column Chart report provides resource managers a single place to view Allocation compliance for various resources. It displays the following: Allocated Hours by OBS chart: Stacked Column chart that displays percentage of resources that are fully allocated (80 -120 %) and under allocated (less than 80%) for a particular OBS and selected period range. Grid: Displays Resource Name, Resource Id, Primary Role, Booking Manager, Period, Allocated hours and Actual hours during that period. You can further narrow your search by OBS Type, OBS Path & Period Start Date range.
 -
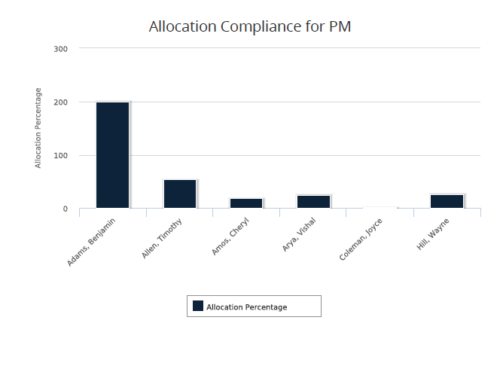 Allocation Compliance for PM report gives a view of resource Allocation percentage for active resources on the team of an investment for a selected Investment Manager. It allows the PM to see resources on their project over the coming months and whether they are over or under allocated. Allocation Percentage is calculated as (‘Allocated Hours’ / ‘Available Hours’) * 100. User can further narrow their search Month Start Date and Investment Manager. User can use exact dates or relative dates for Month Start Date filter parameter.
 -
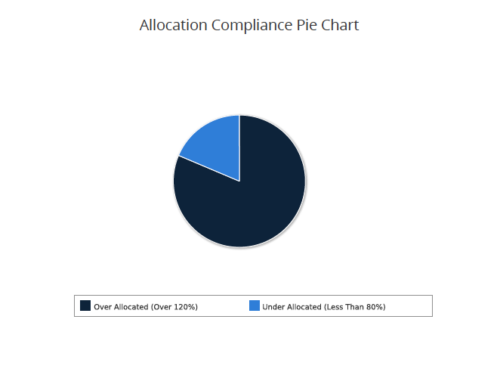 Allocation Compliance Pie Chart provides the resource manager a single place to view the Allocation compliance information in the form of a Pie chart. Allocation Compliance is calculated based on the value of 'Availability to Allocation Hours %'. Allocation Compliance is 'Under Allocated (Less Than 80%)' WHEN 'Availability to Allocation Hours %’ is less than 80. Allocation Compliance is 'Appropriately Allocated (Between 80-120%)' WHEN 'Availability to Allocation Hours %' is between 80 and 120. Allocation Compliance is 'Over Allocated (Over 120%)' WHEN 'Availability to Allocation Hours %' is greater than 120. User can further narrow their search by Resource Is Active?, OBS Type, OBS Path, Allocation Start Date, Investment Name and Resource Manager. User can use exact dates or relative dates for Allocation Start Date filter parameter.
 -
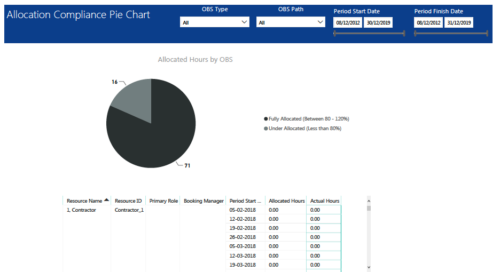 Allocation Compliance Pie Chart report provides resource managers a single place to view Allocation compliance for various resources. It displays the following: Allocated Hours by OBS chart: Pie chart that displays percentage of resources that are fully allocated (80 -120 %) and under allocated (less than 80%) for a particular OBS and selected period range. Grid: Displays Resource Name, Resource Id, Primary Role, Booking Manager, Period, Allocated hours and Actual hours during that period. You can further narrow your search by OBS Type, OBS Path & Period Date range.
 -
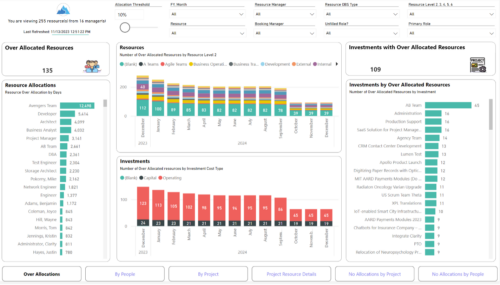
 Evaluate resource allocations, identify bottlenecks, and ensure optimal resource utilization across projects and teams. Report Views include: • Over Allocation • By Project • By People • Project Resource Details • No Allocations by Project • No Allocations by People The main .rpt file will access data through the Data Warehouse.
 -
 Very seldom will an organization only deliver using Agile. Some work lends itself better in using Waterfall. The need for a dual operating model will drive the need for a deliberate tooling architecture that will usually include a PPM and an Agile tool.
 -
 Lean Portfolio Management (LPM) is one of the seven SAFe components of the Lean Enterprise. LPM helps organizations solve numerous challenges by decreasing the delivery of time to value, enabling the organization to pivot quickly in ever-shifting markets, and more.
 -
 Annual planning shouldn’t be an Excel nightmare—or disconnected from strategy. In this session, see how one organization used Strategic Portfolio Management (SPM) with Clarity to transform their budgeting process from reactive to strategic.
 -
 A presentation slide deck from Rego University 2022. The document reviews the best practices around annual planning for your Clarity instance.
- Introduction
- Annual Planning Basics
- Clarity in Annual Planning
- Investment Tracking
- Resource Planning
- Financial Tracking
- Prioritization
-
 Course Description: Does your organization want to implement application portfolio management (APM)? Are you trying to determine the value in implementing APM? Are you struggling to know what tool you should use and what data is important to collect? This session will review specific use cases of companies that have implemented APM and effectively used the data to drive value for the organization.
 -
 Course Description: A review of the basics around APM. Covering Business Capabilities, Application Scoring, and Best Practices.
 -
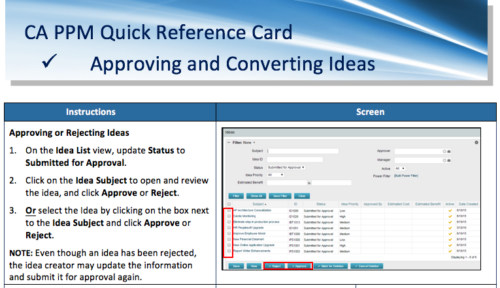 A Quick Reference Card to assist in the approving/rejecting of Ideas. Included converting Ideas once approved.


Copyright 2023 • Rego Consulting Corporation • Privacy Policy