-
 Struggling to use an external scheduler like MS Project or Smartsheet with Clarity or investigating its potential? Learn how to effectively use these tools with Clarity in this training, which includes best practices and lessons learned. We will show both OOTB and Rego build connectors that will make the bidirectional connections seamless.
 -
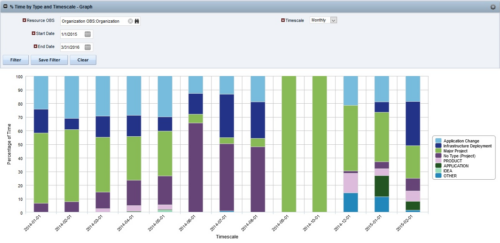
 The Percent Time by Type and Timescale - Graph portlet shows a breakout of time by timescale for resources the logged in user has view rights to. This portlet gives the Clarity user the ability to show the amount of hours spent on each project type by week, month, quarter and year. Using this portlet, the Clarity user can get an overview of all hours in a time period or use the filter to search for a specific dataset (as required). The portlet provides a filter for OBS and date ranges.
 -
 A Quick Reference Guide to assist in the creation and management of Status Reports in Clarity’s Modern UX. Reviews accessing the project details from the grid or tile view, creation of a new status report, existing status reports in Classic, updating status reports, customizing project status, and the project status list view.
 -
 This training document is a Rego Consulting Quick Reference Guide to assist with the process of converting an idea to a project in Clarity’s Modern User Experience.
 -
 This training document is a Rego Consulting Quick Reference Guide to assist with the creation of Budget Plans in Clarity’s Modern User Experience. The document reviews submission of a cost plan for approval, approving or rejecting submitted budgets and Budget Plan facts.
 -
 Do you want to understand the OOTB configuration and functionality of financial management? In this class, we will review the OOTB objects, views, views, and functions of financial plans, rates, and other related areas. We will cover both newUX gaps from classic. We will discuss best practices.
 -
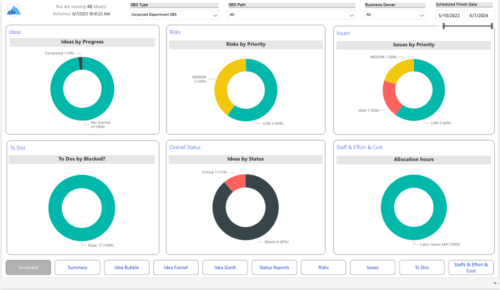 Master your pipeline as you prioritize, visualize, and analyze ideas, assess their feasibility, and track progress from inception to execution. Report Views include: • Idea Bubble • Idea Details • Idea Funnel • Idea Gantt • Idea Overview • Idea Staff and Effort • Idea Status • Idea To Dos Demo Video - https://www.youtube.com/watch?v=xPSxOlrqEq8&list=PLXJ5ktuWV0jiS9CvBpHvBIwpKPmA9uvwK&index=3 The main .rpt file will access data through the Data Warehouse. For clients on Rego’s AWS hosting, we have versions that work with Oracle and Postgres DB and access the live database, if the Rego Odata connector is being used.
 -
 A Quick Reference Guide to assist in managing project task in Clarity’s Modern UX via the Task List Tab. Reviews accessing the Task Tab, manage task in the Grid, Board and Timeline views.
 -
 This training document is a Rego Consulting Quick Reference Guide to assist with the My Tasks View in Clarity’s Modern User Experience. Guide shows how Tasks are access by use of the Task icon in the menu.
 -
 This training document is a Rego Consulting Quick Reference Guide to assist with utilization of the Staffing page in Clarity’s Modern User Experience. This doc references version 16.2.1 views. Document provides detail on the layout and capabilities of the Staff Grid as well as the Allocations Timeline. Information is provided on columns, widgets and filtering. Instructions are provided on how to save Views. Summary information is provided on the layout of the Allocation Timeline and includes detail on the Investment Timeline and the Resource Histogram. Investment Timeline summary contains information on the Allocations by Investments and the Allocations by Resources tabs. While the Resource Histogram section provides screenshots on Resource Availability and Resources by Role.
 -
 A Quck Reference Guide to assist in the application of Field Level Security for Groups in Clarity’s Modern UX. Reviews the process of applying security to specific fields for specific groups.


Copyright 2023 • Rego Consulting Corporation • Privacy Policy