-
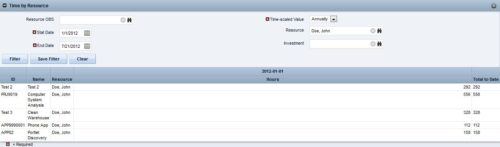
 This portlet displays the actual hours resources entered against investments. The per-period actual hours can be showed in days, weeks, months, quarters, or years. The data can be filtered by Resource, Resource Manager, OBS Unit, Investment and time period
 -
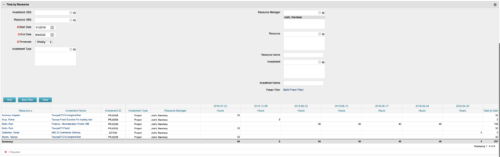
This portlet displays the actual hours resources entered against investments. The per-period actual hours can be showed in days, weeks, months, quarters, or years. The data can be filtered by Resource, Resource Manager, OBS Unit, Investment and time period
-
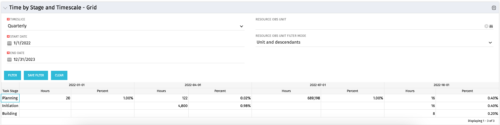 The Time by Stage and Timescale – Grid portlet displays hours for all tasks on projects by their stage for a user-defined time period. The user may narrow the results by time scale, resource OBS unit, and dates. The portlet not only provides the total hours per stage, but also the percentage of time spent on each task type. This portlet pulls data from the timeslices. Using this portlet, management can determine if excess time is being spent on a certain task stage within a project.
 -
The Time by Stage and Timescale – Grid portlet displays hours for all tasks on projects by their stage for a user-defined time period. The user may narrow the results by time scale, resource OBS unit, and dates. The portlet not only provides the total hours per stage, but also the percentage of time spent on each task type. This portlet pulls data from the timeslices. Using this portlet, management can determine if excess time is being spent on a certain task stage within a project.
-
 The Time By Type - Pie Chart portlet is a graphical representation of time by type of investment for all resources the logged in user has security rights to view. This portlet pulls from the daily timeslices, and can be used for determining what types of projects receive the majority of hours. The filter option allows for entry of a specific start date and finish date.
 -
The Time By Type - Pie Chart portlet is a graphical representation of time by type of investment for all resources the logged in user has security rights to view. This portlet pulls from the daily timeslices, and can be used for determining what types of projects receive the majority of hours. The filter option allows for entry of a specific start date and finish date.
-
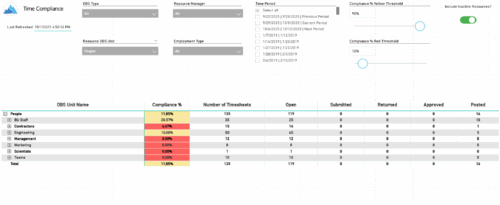 The Time Compliance report displays the timesheet compliance percent, the number of timesheets by status (open, submitted, returned, approved, and posted), and the total for each OBS unit, with the ability to filter and drill down.
 -
 The Time Compliance Detail report displays the timesheet status by resource, their email, employment type, and resource manager, in their respective OBS.
 -
 A slide deck that reviews the processes for time entry and approval of timesheets in Clarity’s Modern UX. Used for Rego’s training engagements, it covers the Time Entry process via flow chart, steps for submitting a timesheet, adjusting a returned timesheet, and adding or removing tasks from a timesheet.
 -
 Is there a way to simplify time tracking? Time is a function 90% of companies use. What are ways to have time be less of a burden to users? How can you minimize the negative perception? This session will discuss options within CA PPM or outside CA PPM to make time tracking less of a burden for all.


Copyright 2023 • Rego Consulting Corporation • Privacy Policy