-
 Rego’s slide deck on the new features added to Clarity with the release of version 15.9.3. Covers the new features: general and use-ability, project management, roadmap/hierarchy, and resource/staffing.
 -
 RegoU Presentation from February 2014. Reports and portlets are an excellent way to communicate information to Clarity users, but you have to make sure they render information quickly. Rapid system response is one of the keys to end-user engagement and adoption. Queries are often created to optimize function over speed. This can affect overall system performance and hurt the user experience. In this session, you will learn some query tricks that Rego developers have used over the years to create high-performing reports and portlets. The video Presentation can be found on YouTube at this location: http://www.youtube.com/watch?v=66Zc44acDhQ&list=PLXJ5ktuWV0jj4TI078BQj4dJFlj1Gsee0&feature=share&index=22
 -
 ** No Download - Do not Add to Cart ** As the world’s largest advanced wastewater treatment plant operator, DC Water depends on a well-designed and comprehensive Project Management Office (PMO) to ensure that its 2.1 million customers have safe drinking water. In this webinar, you'll learn how DC Water joined with Rego to construct an award-winning, metrics-based PMO using Rego’s Clarity innovations. You’ll learn how their partnership resulted in a PMO that: - Drives effective Demand and Portfolio Management for IT projects and programs - Fosters real-time communication between Clarity and Microsoft 365 to keep DC Water’s Management team and Project Management community informed - Allows the IT PMO to measure progress on objectives through metrics ** No Download ** follow this link to sign up to view the recorded webinar - http://info.regoconsulting.com/how-dc-water-partnered-with-rego-march-2021
 -
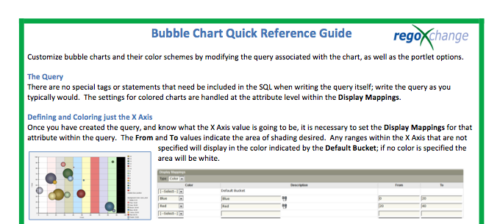 The Bubble Chart Quick Reference Guide provides the user instructions to customize bubble charts and their color schemes by modifying the query associated with the chart, as well as the portlet options. This is very beneficial as it allows the user to match or blend colors among all of the bubble portlets to better display the information the portlets are delivering. Similar data can be one color while different data can be its own color to better show the overall picture.
 -
 Course description: “How do you close the feedback loop with your users? This session will review some innovative ways companies are connecting with CA PPM users to drive constant innovation and improve perception of the process and tool.” Download file is the presentation slide deck.
 -
 Course description: “Did you implement tool functionality without best practice processes? This class will review some of the critical business processes that we recommend organizations put in place before implementing a PPM tool. We will provide tips and tricks on defining process frameworks while leveraging tools for successful enablement.” Download file is the presentation slide deck.
 -
 Course description: “Are you struggling with decision making processes? This session will show you the ins and outs of how a good governance framework provides the foundation for better project decisions to help achieve goals and finish on time and within budget.” Download file is the presentation slide deck.
 -
 Course description: “Are you an NPD CA PPM user? This session is dedicated to NPD users to discuss some of the unique requirements and configurations needed to support project management for new product development.” Download file is the slide deck used for the presentation.
 -
 Course description: “How does my financial forecast and budget (project/program/portfolio) relate to the department/cost center budgets that finance prepares? Is there a better way to link the two together? This is a topic many organizations struggle with, and this session will review tools and processes that can help solve this problem.”
 -
 Course Description: “Does your organization have an external BI tool like Cognos, Tableau, Domo, or Qlikview? This session will review strategies for getting data into your corporate BI tools.” Download file is the slide deck used during the presentation.
 -
 IT is the most common PPM use case, but we are seeing more and more non-IT groups embrace CA PPM. This class will go through the most common PPM use cases outside of IT - Engineering, NPD, PSA, Audit, Marketing, etc.
 -
 Course Description: Does your organization own Workfront in a marketing or other group doing digital asset management? In this session, we will dive into what Workfront is and how it complements your current Clarity PPM solution.


Copyright 2023 • Rego Consulting Corporation • Privacy Policy