
- Defining the Value of a Strategic Roadmap
- Roadmapping Methodology
- Best Practices
- Real-World Examples
- Long-Term Focus
- Short-Term Focus
- Annual Planning Support
-
 A presentation slide deck from Rego University 2022. A course outline for strategic planning for your PPM Tool.
 -
 A presentation slide deck from Rego University 2022. This document reviews the changes to Clarity with the release of version 16.0.3.
- Roadmap Enhancements
- Checklists and To-Dos
- Project and CIT List Enhancements
- Sub-Object Enhancements
- Customer Requests
-
 A presentation slide deck from Rego University 2022. An overview of Rego’s Digital Ecosystem Assessment offering. A holistic assessment that evaluates the current state of your project management practices across the following 4 key business areas to compare against industry best practice. Rego will then develop recommendations for a future state.
- People
- Process
- Technology
- Governance
-
 A presentation slide deck from Rego University 2022. This document reviews the principles of Scaled Agile Framework.
- Understanding Agile, Scrum, and Kanban
- The Limits of Team Agile
- Scaling Agile
-
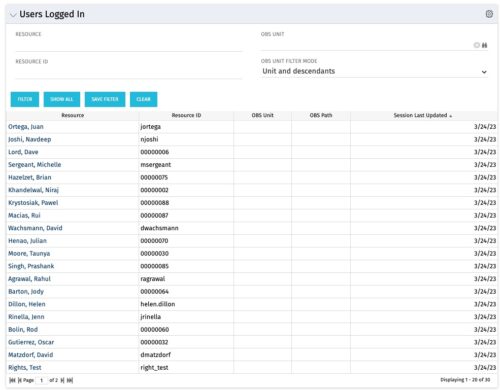 The Users Logged In portlet displays all users logged into the system. This portlet is helpful to determine the capacity during peak times, users still working before downtime, and the ability to view users logged in during the day. The portlet will display the resource, ID, OBS unit, OBS path, and when the user’s session was last updated.
 -
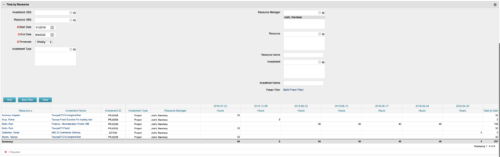 This portlet displays the actual hours resources entered against investments. The per-period actual hours can be showed in days, weeks, months, quarters, or years. The data can be filtered by Resource, Resource Manager, OBS Unit, Investment and time period
 -
This portlet displays the actual hours resources entered against investments. The per-period actual hours can be showed in days, weeks, months, quarters, or years. The data can be filtered by Resource, Resource Manager, OBS Unit, Investment and time period
-
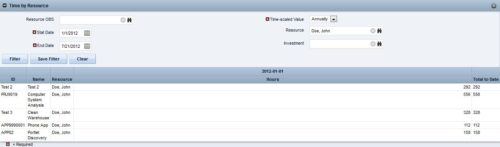
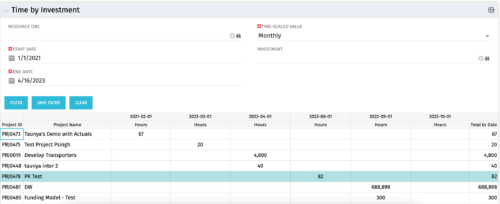 The Time by Investment portlet displays time logged to investments for all investments the logged in user has security rights to view using data from timeslices. It is capable of displaying the data by annual, quarterly, monthly, weekly, and daily segments with totals per date also being presented. The portlet may can be filtered by investment, resource OBS, and time segments. This portlet can be used as a management and governance tool to review aggregate hours posted to investments by time period.
 -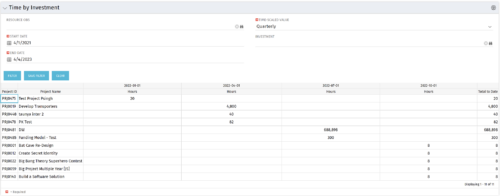
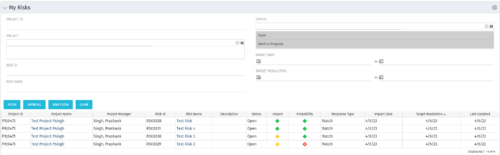 The My Risks portlet displays all risks related to active projects that the logged in user has been assigned as the owner. The portlet provides the logged in user a single place to view risks across multiple projects without having to go into each project individually. The filter then allows the user to narrow their search by Risk ID, Risk Name, Project ID, Project Name, and Risk Status. You may also narrow the view to display issues with a target resolution date or impact date within a certain date range.
 -
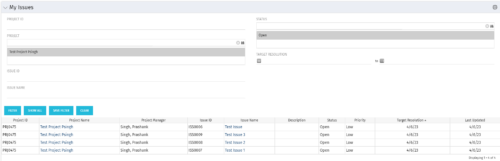 The My Issues portlet displays all issues within active project that the logged in user is assigned to. The portlet provides the logged in user a single place to view issues across multiple projects without having to go into each project individually. The filter then allows the user to narrow their search by Issue ID, Issue Name, Project ID, Project Name, and Issue Status. You may also narrow the view to display issues with a target resolution date within a certain date range.
 -
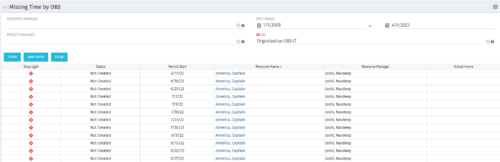 The Missing Time by OBS portlet displays all missing or late timesheets for resources staffed within a specific OBS. Resources will be included if they are open for time entry, have the track mode of ‘Clarity’ and have a timesheet that is not posted. The portlet accommodates for hire and termination dates. Also, the portlet only shows resources that the active user has the security rights to view. Administrators and the Project Management Office may use this portlet to determine the timesheet status of all resources within a specific OBS in open time periods. This portlet allows a user to quickly search by OBS and view all timesheets under that area. After selecting the OBS, the user can also filter on time period start date, Resource Manager and/or Project Manager. The portlet will display a ‘Stop Light’ indicator based on timesheet status, the status, period start, Resource Name, Resource Manager and any actual hours entered for the timesheet.
