-
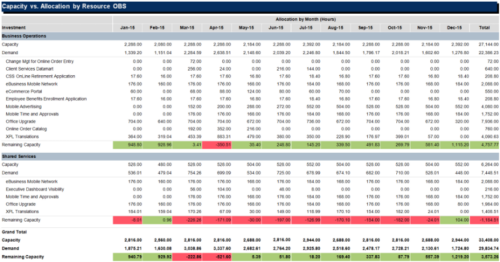
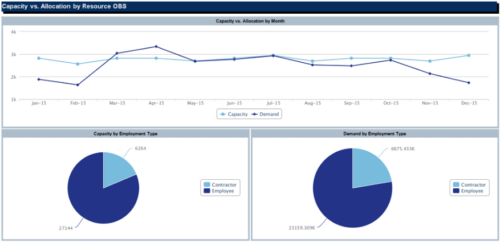 The Capacity vs Allocation by OBS report is a transaction based Jaspersoft report that does not require the Load Jaspersoft Datawarehouse job to be run. The report will pull real-time data from the transaction tables in Clarity. This report can be run from either the Advanced Reporting or Reports and Jobs area within Clarity. The Capacity vs. Allocation by OBS report displays resource capacity and demand across investments. The report can be grouped by any OBS level, providing visibility into resources at any level of the organization. The report displays amounts by week or month, and in total. The amounts can be displayed as hours or FTEs.
 -
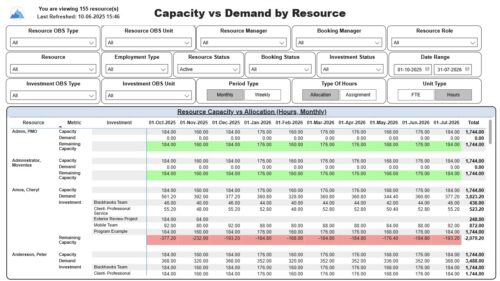 The Capacity vs. Demand by Resource report displays resource capacity and demand at the resource level across investments. The report gives you visibility into the capacity, demand, and remaining capacity by resource. The report displays amounts by week or month, and in total. The amounts might be displayed as hours or FTEs. Report Prerequisites: Verify that you have completed the following prerequisites before you run this report: • The Load Data Warehouse job must be run before you run this report. If the Data Warehouse is not populated, the report will not display any data. Also, most of the report parameters do not display options. • Resource demand allocation amounts display if the resource is allocated to at least one investment and the report display type of hours as allocations. Resource demand assignment amounts display if the resource is assigned to at least one task on the investment and the report displays type of hours as assignments.
 -

 The Capacity Graph portlet displays Availability, Allocations, Actuals and Assignments for one or more active resource(s) in a single view. This portlet pulls data from timeslices, and allows the user to filter on a weekly, monthly or quarterly data. The Estimated Time to Complete (ETC) and Allocation data will only show for projects that are active. This portlet provides Resource Managers, PMOs and Executives with a simple way to analyse: Allocations vs. Availability, Allocations vs. Actuals, Allocations vs. ETC and ETC vs. Availability. The graph allows the user to determine where areas of improvement may exist and quickly identify potential areas of constraint. Note: the information displayed is dependent on what the user has security rights to view.
 -
The Capacity Graph portlet displays Availability, Allocations, Actuals and Assignments for one or more active resource(s) in a single view. This portlet pulls data from timeslices, and allows the user to filter on a weekly, monthly or quarterly data. The Estimated Time to Complete (ETC) and Allocation data will only show for projects that are active. This portlet provides Resource Managers, PMOs and Executives with a simple way to analyse: Allocations vs. Availability, Allocations vs. Actuals, Allocations vs. ETC and ETC vs. Availability. The graph allows the user to determine where areas of improvement may exist and quickly identify potential areas of constraint. Note: the information displayed is dependent on what the user has security rights to view.
-
 Canada Life shares their Clarity Implementation experience, and the lessons learned from the process.
 -
 Are you considering the use of CA PPM's benefits tracking for planned and/or realized benefits? This session will be a review of common use cases for putting benefits forecasts and realized benefits into CA PPM along with the reporting available out of the box and within RegoXchange.
 -
 Course Description: “For clients that have both ServiceNow and CA PPM, passing information between the systems becomes vital for the enterprise with both ITSM and PPM toolsets. One of the biggest areas of interaction is around Demand Management. Come and see Rego's Integration solution which flexibly allows for ServiceNow records (Incident, Problem, Idea, Enhancement, and Demands) to generate CA PPM Ideas or Projects. This lets you control where you want to perform Demand Management, and the work lands in CA PPM's Project either way.” Download is the slide deck used for the presentation.
 -
 Are you struggling with implementing Agile tools in your organization in addition to CA PPM? This class will review best practices for implementing agile tools in conjunction with CA PPM - living in a Bi-Modal world. We will discuss how CA PPM can be used to govern both types of work and teams and how Agile tools should interface into CA PPM.
 -
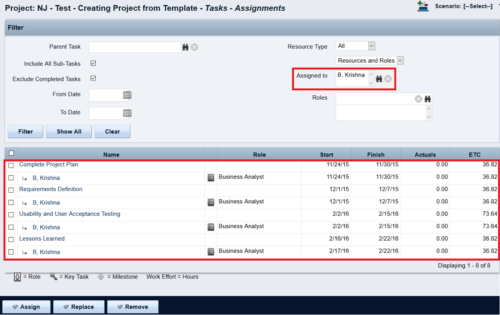
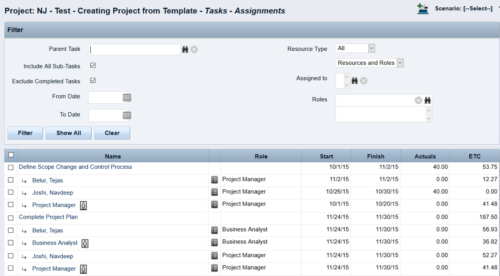 This Tech Trick walks you through the steps in CA PPM to make Bulk Role replacements on tasks. Useful when you want to make the changes to the project template which has a large WBS structure, and a lot of role assignments to tasks.
 -
 A presentation slide deck from Rego University 2022. This course reviewed the value of a strategic roadmap for TBM.
- Defining the Value of a Strategic Roadmap
- Roadmapping Methodology
- Best Practices
- TBM Roadmap Examples
-
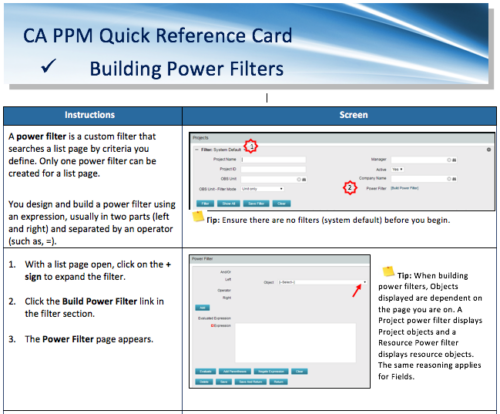 A Quick Reference Card to assist in the building of Power Filters in CA PPM. A power filter is a custom filter that searches a list page by criteria you define. Only one power filter can be created for a list page.


Copyright 2023 • Rego Consulting Corporation • Privacy Policy