-
 Course description: “It’s easy to focus on the “cool” new features of the latest release and overlook the impact on specific End Users, and how they actually use new features and modules. Focusing on what Users need and want may not be easy, but it will lead to greater engagement, strong adoption and increase value of CA PPM. Join Empowered Networks for this session to discuss how to leverage User Personas in configuring CA PPM.”
 -
 Have you ever thought about tracking customer feedback as part of your project closure? This class will show how lessons learned can be entered and tracked within CA PPM.
 -
 Lean Portfolio Management (LPM) is one of the seven SAFe components of the Lean Enterprise. LPM helps organizations solve numerous challenges by decreasing the delivery of time to value, enabling the organization to pivot quickly in ever-shifting markets, and more.
 -
 Lean Portfolio Management (LPM) is one of the most researched and in demand topics for modern enterprises. Come learn what LPM is, key LPM practices and roles needed for success, and how Clarity and Rally provide end to end visibility from strategy to execution.
 -
 A presentation slide deck from Rego University 2022. This document reviews the importance and principles of Organizational Change Management.
- Why is Organizational Change Management Important?
- Impacts of not recognizing the need for an Organization Readiness (OR) Plan
- What are the components of Organizational Change Management?
- Considerations and activities for building a good OR Plan
- How to execute Organizational Change Management
- Framework – Proven Methodologies and Tools
- Q&A
-
 Are you on an older version of Clarity? Do you want to understand the value of the new features and functions in recent versions? This class is a demonstration of the new features and the value of these features for customers.
 -
 A presentation slide deck from Rego University 2022. This document reviews the changes to Clarity with the release of version 16.0.3.
- Roadmap Enhancements
- Checklists and To-Dos
- Project and CIT List Enhancements
- Sub-Object Enhancements
- Customer Requests
-
 Are you on an older version of Clarity? Do you want to understand the value of the new features and functions in recent versions? This class is a demonstration of the new features and the value of these features for customers.
 -
 Do you want to understand the value of the new functionality in Clarity's most recent rollout? This class is for you! Attend an interactive demonstration and put these capabilities in action today.
 -
 Course Description: Are you using an older version of Clarity PPM? Do you want to understand the value of new features and functions in recent versions? This class is a demonstration of the new features and the value of these features for customers.
 -
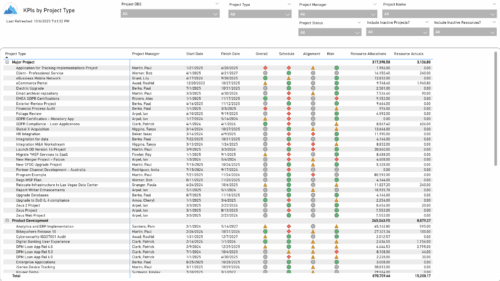 The KPIs by Project Type report provides a consolidated view of key performance indicators across projects, grouped by project type. It highlights metrics such as overall status, schedule, alignment, and risk, along with resource allocation and actual hours tracked since each project’s inception. This report enables quick comparison of performance trends and resource utilization across different project types.
 -
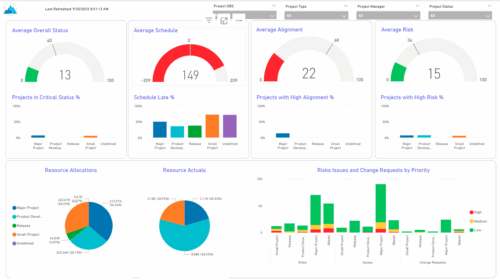 The KPIs by Project Type (Dashboard) report provides visibility into key project health measures, including status, schedule, alignment, and risk. Gauge visuals highlight each KPI at a summary level, while column charts break down results by project type. Resource allocation and actual hours are summarized in pie charts, making it easy to compare utilization across project types. In addition, bar charts display the number of issues, risks, and change requests by project type and priority, helping teams quickly identify areas of concern.


Copyright 2023 • Rego Consulting Corporation • Privacy Policy