-
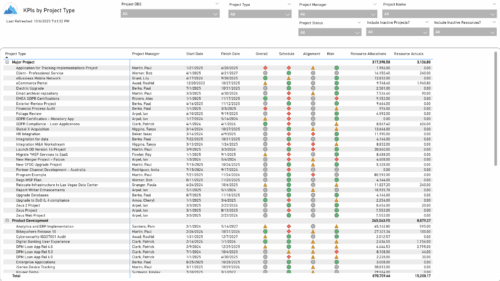 The KPIs by Project Type report provides a consolidated view of key performance indicators across projects, grouped by project type. It highlights metrics such as overall status, schedule, alignment, and risk, along with resource allocation and actual hours tracked since each project’s inception. This report enables quick comparison of performance trends and resource utilization across different project types.
 -
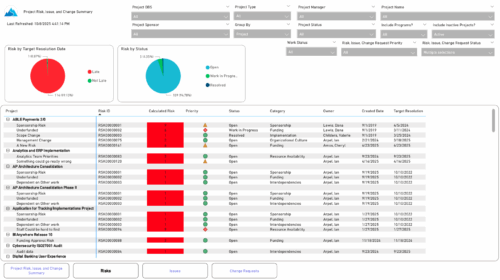 The Project Risk, Issue, and Change Summary report provides an overview of project health by visualizing risks, issues, and change requests. It includes pie charts that display counts by target resolution or expected close date, as well as by status. A detailed table lists each item’s name, ID, priority, status, category, owner, creation date, and resolution or close date. Results can be grouped by project or viewed without grouping to support flexible analysis and tracking.
 -
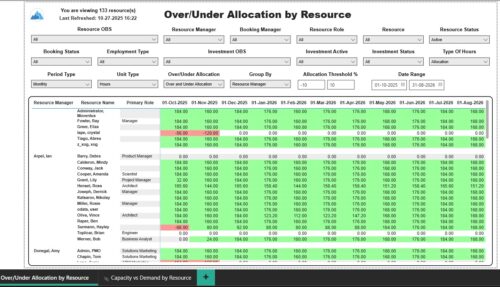 The Over/Under Allocation by Resource report displays resource remaining capacity amounts by resource. The report displays amounts by week or month. The amounts can be displayed as hours or FTEs. This report allows you to drill down to the Capacity vs. Demand by Resource report, by clicking a resource name, to see more information about the resource capacity and demand. Report Prerequisites Verify that you have completed the following prerequisites before you run this report: • The Load Data Warehouse job must be run before you run this report. If the Data Warehouse is not populated, the report will not display any data. Also, most of the report parameters do not display options.
 -
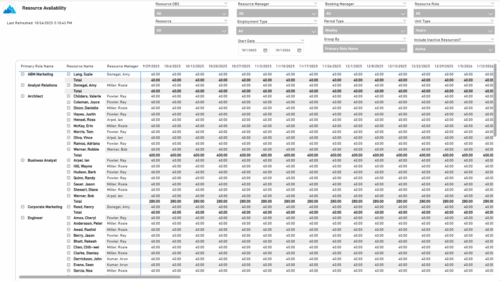 The Resource Availability report provides visibility into each resource’s available capacity across projects. It allows users to view availability by resource, grouped by either resource manager or primary role, helping identify under- or over-utilized team members. The report can display data by week, month, or in total, and amounts can be viewed in hours or full-time equivalents (FTEs).
 -
 The All Assignments portlet displays resource assignments across multiple projects. Currently, assignment information displayed for the project, in OWB, or MSP is limited to a single project. This portlet will provide a single view of the assigned data for all assignments across multiple projects. The portlet displays project actuals and estimates from the project (datamart tables). The Days Late field is calculated by the baseline date, while the Days Old field is calculated by today's date. Note: Only the projects that the user has viewer rights to will show up in the list. Filters provide the PM, RM, and individual resource the ability to monitor work progress across multiple projects. For example: ~ PMs can filter for all assignments that were to be completed by a given date but still have "Started" or "Not Started" status. ~ If multiple projects are utilizing the same resource, the PM or RM can filter for assignments utilizing that specific resource to prevent over-utilization. ~ A resource may filter for all assignments assigned to them, providing a picture of their total body of work.
 -
The All Assignments portlet displays resource assignments across multiple projects. Currently, assignment information displayed for the project, in OWB, or MSP is limited to a single project. This portlet will provide a single view of the assigned data for all assignments across multiple projects. The portlet displays project actuals and estimates from the project (datamart tables). The Days Late field is calculated by the baseline date, while the Days Old field is calculated by today's date. Note: Only the projects that the user has viewer rights to will show up in the list. Filters provide the PM, RM, and individual resource the ability to monitor work progress across multiple projects. For example: ~ PMs can filter for all assignments that were to be completed by a given date but still have "Started" or "Not Started" status. ~ If multiple projects are utilizing the same resource, the PM or RM can filter for assignments utilizing that specific resource to prevent over-utilization. ~ A resource may filter for all assignments assigned to them, providing a picture of their total body of work.
-
 The All Issues portlet displays all Issues related to active projects that the logged in user has view rights to. The portlet provides the project manager a single place to view issues across multiple projects without having to go into each project individually, and allows for more efficient management and reporting across projects. The filter then allows the user to narrow their search by Issue ID, Issue Name, Project ID, Project Name, the individual to whom the issue is assigned, and Issue Status. You may also narrow the view to display issues with a target resolution date within a certain date range, or Issues associated with a particular Category or OBS unit. Note: Only the projects that the user has viewer rights to will show up in the list.
 -
 The All Risks portlet displays all risks related to active projects that the logged in user has view rights to access. The portlet provides the project manager a single place to view risks across multiple projects without having to go into each project individually, and allows for more efficient management and reporting across projects. The portlet displays Project ID, Project, Risk ID, Risk, Category, Assigned to, Status, Probability, Impact, Priority, Target Resolution Date, and Days opened. The filter allows narrowing down of the risks by several different criteria. Note: Only the projects that the user has viewer rights to see will show up in the list.
 -
 The Executive Dashboard portlet displays information regarding projects the user has security rights to view. It provides a one-stop place for the PMO or management to view all critical information about projects. The portlet not only displays status indicators as well as dates for late items, variances and days late, but also displays the project status fields from the Status Report sub-object.
 -
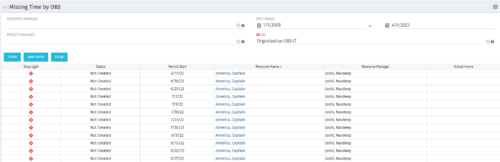 The Missing Time by OBS portlet displays all missing or late timesheets for resources staffed within a specific OBS. Resources will be included if they are open for time entry, have the track mode of ‘Clarity’ and have a timesheet that is not posted. The portlet accommodates for hire and termination dates. Also, the portlet only shows resources that the active user has the security rights to view. Administrators and the Project Management Office may use this portlet to determine the timesheet status of all resources within a specific OBS in open time periods. This portlet allows a user to quickly search by OBS and view all timesheets under that area. After selecting the OBS, the user can also filter on time period start date, Resource Manager and/or Project Manager. The portlet will display a ‘Stop Light’ indicator based on timesheet status, the status, period start, Resource Name, Resource Manager and any actual hours entered for the timesheet.
 -
 A presentation slide deck from Rego University 2022. The document reviews creating views and using Apps in Rally. Then digs into creation of Dashboards.
- Refresh on Creating View and Using Apps
- Introduction to Concepts of Dashboards
- Configuring Dashboards & Apps
- Patterns of Useful Dashboards
- Dashboard Patterns
- Examples
- Exercise: Lets create a Dashboard
-
 A presentation slide deck from Rego University 2022. This document reviews the principles of Lean Portfolio Management. • What is Lean Portfolio Management (LPM)? • Artifacts of the LPM • Roles of the LPM • Ceremonies of the LPM


Copyright 2023 • Rego Consulting Corporation • Privacy Policy