-
 Course Description: This session will walk you through a step-by-step approach to doing application rationalization within your organization. We will also review how to sell the benefits and processes within your organization.
 -
 Do you want to know more about building integrations using CA PPM's web services? This session will be a hands-on lab to build a web service-based integration and discuss situations where other web services can be used.
 -
 Do you want to understand what other organizations are doing to manage ongoing CA PPM enhancements and releases? This class will review some best practices we have seen within our customers to managing a successful backlog of CA PPM work.
 -
 Looking for more value in Open Workbench? Learn tricks to decrease the time you spend on project management, as well as best practices around plans, baselines, and dependencies.
 -
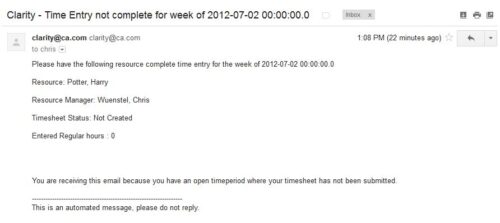 The Time Tracking Stalker – Resource workflow process is used to notify resources that fail to submit a timesheet in a prior week. The workflow checks for active resources, hire/termination dates, track mode, and open for time entry. This process helps to ensure resources submit timesheets in a timely manner. In version 13, the email can be enhanced to include colors, bold, underline, and other HTML formatting.
 -
 Course description: “Do you want to learn how to get basic data out of CA PPM for use in portlets? This class will review the basic CA PPM data model and provide training on how to write queries within CA PPM for use in your portlets and reports.” Download file is the slide deck used during the class.
 -
 Course description: “Is there a way to simplify time tracking? Time is a function 90% of companies use. What are ways to have time be less of a burden to users? How can you minimize the negative perception? This session will discuss options within CA PPM or outside CA PPM to make time tracking less of a burden for all.” Download file is the presentation slide deck.
 -
 This video covers the process of adding tasks to the timesheet using Populate and Add Task, using the timesheet notes functionality, entering timesheet data, updating ETC via the timesheet, and submitting the timesheet.
 -
 This video reviews how to return and approve Clarity timesheets as a Project or Resource Manager.
 -
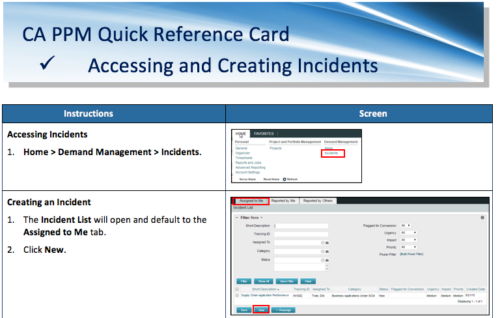 A Quick Reference Card to assist in the accessing and creation of Incidents in CA PPM. Incidents can be found by going to Home, then Demand Management to the Incident list menu item.
 -
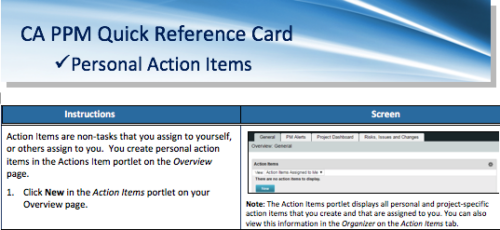 A quick reference card to assist you in making Action Items in CA PPM. Action Items are non-tasks that you assign to yourself, or others assign to you. You create personal action items in the Actions Item portlet on the Overview page.
 -
 This paper will help you launch a PMO—or facelift the one you’ve got—by making sure your PMO charter can handle strategic heavy lifting. It covers everything from getting stakeholder buy-in to achieving successful adoption throughout your organization. This White Paper is downloaded from the Rego Consulting site. You will be asked to provide your email address and current ppm tool. - http://info.regoconsulting.com/launch-pmo-whitepaper ** No Download - Do not Add to Cart **


Copyright 2023 • Rego Consulting Corporation • Privacy Policy