-
 Course Description: Do you already have a basic understanding of Jaspersoft Studio development? This session will include advanced topics like duplicating and modifying an OOTB report, multiple datasets, subreports, charting, widgets integration, and crosstabs. The detailed agenda is as follows: Jaspersoft Advanced – Out-of-the-Box Customization (2 hours) • Discover how to use OOTB reports, OOTB domains, resource bundles, and security access grant schemas. Jaspersoft Advanced – Chart Development (2 hours) • Explore multiple advanced charting techniques and types using built-in charting components, including properties (colors, plot options, sizing, gauges, etc.), dual pie chart, time series, and heat map. Jaspersoft Advanced – Scriptlets (2 hours) • Understand the basics of Jaspersoft Studio scriptlet development, utilizing Java libraries in custom Java classes to perform complex tasks in a simple manner. Jaspersoft Advanced – Roundtable (1 hour) • Understand crystal capabilities missing in Jaspersoft Studio, including sharing examples, report bursting needs, automation needs, and working with internal BI groups.
 -
 Does your organization struggle with resource management? Have you considered creating a Resource Management Office (RMO)? This session will review how some organizations are using RMOs to drive adoption and effectively manage resources, including real world examples of RMO setup and execution.
 -
 The Dashboard: Project Information portlet gives a set of high-level information about the project. The portlet will pull the "id" from the page it is placed on, so this portlet is usually placed on the project dashboard tab. The portlet displays the name, project ID, project manager, description, start date, finish date, baseline start, and baseline finish.
 -
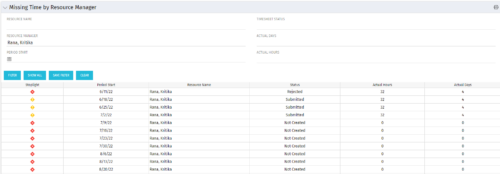 The Missing Time by RM portlet displays all missing or late timesheets for resources for which the logged in user has resources (logged in user is the RM). Resources will be listed if they are open for time entry, have a track mode of Clarity, and have timesheet that is not posted (accommodates for hire and termination dates). Resource managers may use this portlet to determine the timesheet status of all resources in open time periods. The portlet will display an indicator based on timesheet status, the status, period start, resource name, and actual hours for the timesheet.
 -
 This training document is a Rego Consulting Quick Reference Guide to assist with the creation of Hierarchies in Clarity’s Modern User Experience. This doc references version 16.1 views. Document provides information on how to import investments and how to create child / parent relationships. Detail is provided with regard to the export of Hierarchies to PDF format.
 -
 This training document is a Rego Consulting Quick Reference Guide to assist with utilization of the Staffing page in Clarity’s Modern User Experience. This doc references version 16.1 views. Document provides detail on the layout and capabilities of the Staff Grid as well as the Allocations Timeline. Information is provided on columns, widgets and filtering. Instructions are provided on how to save Views. Summary information is provided on the layout of the Allocation Timeline and includes detail on the Investment Timeline and the Resource Histogram. Investment Timeline summary contains information on the Allocations by Investments and the Allocations by Resources tabs. While the Resource Histogram section provides screenshots on Resource Availability and Resources by Role.
 -
 A presentation slide deck from Rego University 2022. This course reviewed Adoption Metrics and Reliable Data Collection.
- Reliable Data Collection and Business Performance
- Adoption Metrics and Customer Adoption
- Data Quality, Data Integrity and Ensuring User Confidence
- Business Performance
- Reliable Data Collection and Business Performance
-

A presentation slide deck from Rego University 2022. This document reviews the best practices for project management in Clarity. - Typical PM Activities
- Use Clarity: Get Off of Excel
- Make Information Easier to Access
- Make Flags Easy to Identify
- Simplify & Automate Reporting
- Open Discussion #3
- Work with a Regular Cadence
- Sample Schedule
-
 A presentation slide deck from Rego University 2022. This document reviews how Clarity and Apptio can work together.
- Typical Challenges
- Apptio Introduction
- Clarity / Apptio Solution
- Rego’s BETA Integration
-
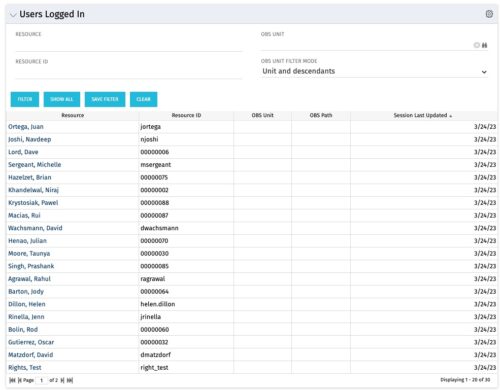 The Users Logged In portlet displays all users logged into the system. This portlet is helpful to determine the capacity during peak times, users still working before downtime, and the ability to view users logged in during the day. The portlet will display the resource, ID, OBS unit, OBS path, and when the user’s session was last updated.
 -
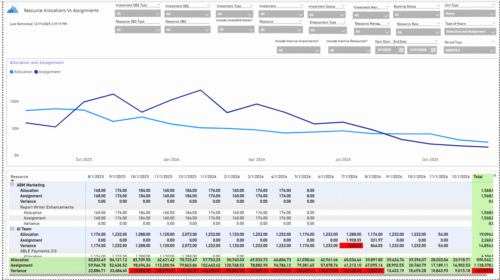 The Allocations and Assignments report displays resource assignments and allocations across multiple projects. This report will provide a single view of the assigned data for all assignments across multiple projects in-line with their allocations. The data is displayed by monthly periods. The horizontal and vertical sums provide a cumulative picture resource wise and month wise respectively. Filters provide the user the ability to monitor data across multiple projects. Filters include investment type, investment, resource, active/inactive resource or investment along with OBS type and OBS unit. If multiple projects are utilizing the same resource, the PM or RM can filter for assignments/allocations utilizing that specific resource to prevent over-allocations or under-allocations.
 -
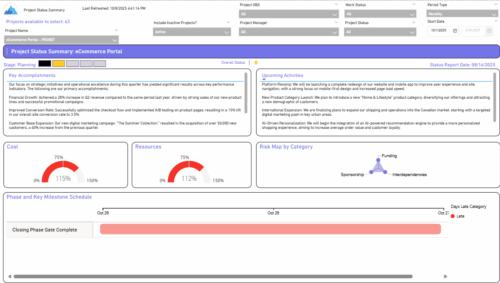 The Project Status Summary report highlights the overall health and progress of a project by summarizing key information such as current stage, status indicators, major accomplishments, upcoming activities, and resource and cost consumption. It also visualizes risk concentration across categories and includes a high-level Gantt chart showing major phases and milestones. This report provides a clear snapshot of project performance for quick executive or stakeholder review.


Copyright 2023 • Rego Consulting Corporation • Privacy Policy