-
 Do you want to add interfaces to your CA PPM instance? This class will review the pros and cons of various integration methods and provide best practice on how to handle various interfaces. We’ll walk you through specific interface examples and showcase Rego’s pre-built interface sets you can leverage to reduce the time and cost of implementation.
 -
 Do you want to add REST interfaces to your Clarity instance? We’ll walk you through specific custom interface examples in GEL and showcase Rego’s Data Processor REST capabilities you can leverage to reduce the time and cost of implementation.
 -
 Do you want to know more about building integrations quickly and easily? We will also show Rego's data processor and extraction tool and how it can be used for all outbound file-based integrations to save money and time.
 -
 A presentation slide deck from Rego University 2022. This document outlines the advantages of using the Rego Data Processor and Data Extractors for integrations with other software tools. • Introduction • Understanding Clarity and its Architecture • Why use Integrations • Wheel and Spoke • Outbound Integrations • Inbound Integrations • Rego’s Approach • Rego’s Data Processor • Rego’s Data Extractor • Recommendations
 -
 Do you want to know more about building integrations quickly and easily? We will also show Rego's data processor and extraction tool and how it can be used for all outbound file based integrations to save money and time.
 -
 Course Description: In the new bimodal IT environment, does your organization lack insights into what Agile work is being done and what value is being delivered? Learn how Apptio Agile Insights merges data from multiple Agile tools, including Clarity PPM, to bring together a total picture of the value IT is delivering.
 -
 Want to boost Clarity adoption and data quality, all while having fun and keeping users engaged? Learn how gamification can benefit your organization in this exclusive demo. Check out features that reward users for desired behaviors, enable personalization, and offer fun ways to track project health through the animated world of Planimals.
 -
 What if you could see tomorrow’s challenges and opportunities before they happen? Join us for an exclusive demo of new Predictive Analytics features for Clarity. You'll discover how predictive insights can deliver early warnings, risk signals, and actionable recommendations—empowering you to move from reactive firefighting to proactive decision-making.
 -
 Rego’s training materials on Clarity PPM Financials. This slide deck in based on the classic version of Clarity v15.4.1. Course materials start with an introduction, move to Cost Plans, Budget Plans and then finish with Reporting of Financial Data. There is also an appendix of supporting information.
 -
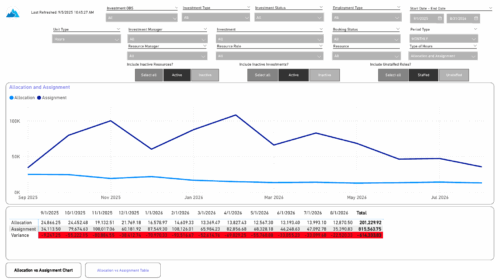 The Investment Allocations and Assignments report provides visibility into team member allocation, task assignment, and variance amounts by investment across time periods. A chart highlights allocation compared to assignment amounts by period. Results can be displayed by week, month, or in total, and viewed in either hours or FTEs for each team member and investment. Interactive visuals make it easy to compare planned effort against actual assignments at the team member and investment level. Content Type: Business Intelligence, PowerBI Report
 -
 Part of the Business Transformation Collection, this bubble-chart portlet displays investments per their alignment, status and total planned benefit. The: X-axis displays the alignment Y-axis displays the status Bubble-size displays the total planned benefit
 -
Part of the Business Transformation Collection, this bubble-chart portlet displays investments per their alignment, status and total planned benefit. The: X-axis displays the alignment Y-axis displays the status Bubble-size displays the total planned benefit


Copyright 2023 • Rego Consulting Corporation • Privacy Policy