-
 This training document is a Rego Consulting Quick Reference Guide to assist with the creation of Cost Plans in Clarity’s Modern User Experience. Instructions are provided on how to access Cost Plans from the Financials tab and how to create a new Cost Plan. Detail is provided on how to create a cost plan with project information (Populate from Allocations and Populate from Assignments), how to manually enter data into a cost plan and how to set a cost plan as the Plan of Record.
 -
 This training document is a Rego Consulting Quick Reference Guide to assist with the management of the Grid View within Hierarchies in Clarity’s Modern User Experience. This doc references version 16.0.3 views. Document covers information on how to export to CSV, filter, create and save Views, use of the Column Panel and the Details panel.
 -
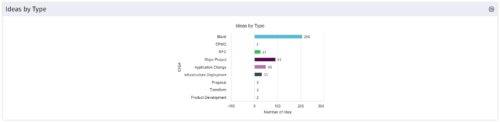 This is a great way to review demand by type and evaluate where demand is coming from and who will be impacted. Displays a bar graph of all ideas group by type.
 -
 An updated version of our training material for Jaspersoft Ad-Hoc Reporting for Clarity. Introduces Jaspersoft as a reporting tool, explains security, the data warehouse, and JS Domains. Then delves into navigation, running a report, creating an ad-hoc report, saving it, creating a cross tab report, creating a chart, creating a dashboard, and scheduling the report.
 -
 A Quick Reference Guide to assist in the process of running a Jaspersoft Report. Guide walks through the steps and has screen shots to assist in the process.
 -
 A Quick Reference Guide to assist in the process of creating a crosstab in a Jaspersoft Ad-hoc report. The document uses screenshots to walk you through the process.
 -
 A Quick Reference Guide to assist in the process of creating a chart in Jaspersoft. The guide walks through the steps using screenshots.
 -
 A Quick Reference Guide to assist in creating or adding Calculated Fields or Measures to a Jaspersoft Report. Calculated Fields or Measures can be created and added to a new or existing Ad-Hoc view by applying formulas to the measures.
 -
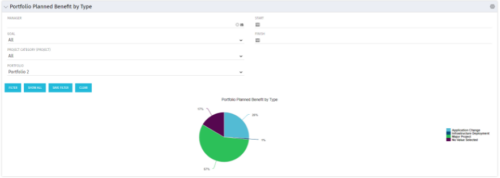 Part of the Business Transformation collection, this pie chart portlet displays realized benefit, grouped by type of project, for portfolio investments. It uses System Provider: Portfolio Investment Provider.
 -
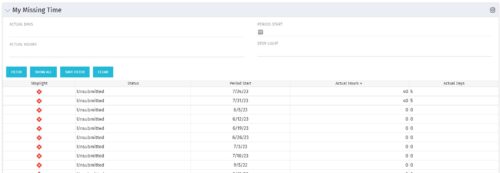 The My Missing Time portlet displays all open time periods for which the logged in user (assuming they are open for time entry with a track mode of Clarity) has a timesheet that is not posted (accommodates for hire and termination dates). The portlet is used as a quick reference for users to view their missing time.
 -
 Part of the Business Transformation Collection, this bubble-chart portlet displays investments per their alignment, status and total planned benefit. The: X-axis displays the alignment Y-axis displays the status Bubble-size displays the total planned benefit
 -
Part of the Business Transformation Collection, this bubble-chart portlet displays investments per their alignment, status and total planned benefit. The: X-axis displays the alignment Y-axis displays the status Bubble-size displays the total planned benefit


Copyright 2023 • Rego Consulting Corporation • Privacy Policy