-
 This training document is a Rego Consulting Quick Reference Guide to assist with the creation of Benefit Plans in Clarity’s Modern User Experience. This doc references version 16.0.3 views. Doc provides detail on how to create a Benefit Plan, how to categorize Benefit Class and Benefit Subclass, how to add financial values to your Benefit Plan, and how to add the Benefit Plan to your Cost Plan.
 -
 This training document is a Rego Consulting Quick Reference Guide to assist with the management of Budget Plans in Clarity’s Modern User Experience. This doc references version 16.0.3 views. Doc provides detail on how to submit a cost plan for approval, how to approve or reject submitted budgets and also provides additional detail on the rules that apply to the submission of budget plans.
 -
 This training document is a Rego Consulting Quick Reference Guide to assist with the creation of Cost Plans in Clarity’s Modern User Experience. Instructions are provided on how to access Cost Plans from the Financials tab and how to create a new Cost Plan. Detail is provided on how to create a cost plan with project information (Populate from Allocations and Populate from Assignments), how to manually enter data into a cost plan and how to set a cost plan as the Plan of Record.
 -
 This training document is a Rego Consulting Quick Reference Guide to assist with the entering of financial transactions in Clarity’s Classic User Experience. This doc references version 16.0.3 views. Document provides basic information on the definition of a transaction and the composition of transaction items. Detail is provided on how to create a new transaction from the Transaction Entry page of the Classic User Experience. Information is provided on how to enter detail into each individual line item for a transaction.
 -
 This training document is a Rego Consulting Quick Reference Guide to assist with Financial Actuals and Reporting in Clarity’s Modern User Experience. This doc references version 16.0.3 views. Document includes detail on which jobs should be run to ensure project and financial data is synchronized with the latest posted actuals. Information is provided on how to analyze cost plans and how to review actual transactions. Instructions are provided on how to analyze budget plans.
 -
 This training document is a Rego Consulting Quick Reference Guide to assist with the management of project Financials in Clarity’s Modern User Experience. This doc references version 16.0.3 views. Document includes summary information on the Financials module and provides detail on how to customize the grid and save views. Instructions are provided on how to filter data and how to use the ⋮ (vertical ellipses) icon to access further features. Detail is provided on the group by function, the column panel, the export of cost plan and editing cost plan and budget plan data from the grid.
 -
 This training document is a Rego Consulting Quick Reference Guide to assist with the management of the Card View within Hierarchies in Clarity’s Modern User Experience. This doc references version 16.0.3 views. Document provides detail on View Options, Color By, Card Fields and Card Metrics. Information on how to roll up metrics via an aggregation or calculation method.
 -
 This training document is a Rego Consulting Quick Reference Guide to assist with the creation of Hierarchies in Clarity’s Modern User Experience. This doc references version 16.0.3 views. Document provides information on how to import investments and how to create child / parent relationships. Detail is provided with regard to the export of Hierarchies to PDF format.
 -
 This training document is a Rego Consulting Quick Reference Guide to assist with the management of the Grid View within Hierarchies in Clarity’s Modern User Experience. This doc references version 16.0.3 views. Document covers information on how to export to CSV, filter, create and save Views, use of the Column Panel and the Details panel.
 -
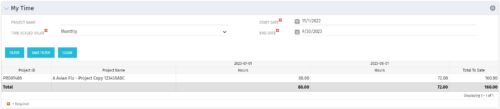 The My Time portlet provides the logged in user with the ability to view his or her time by project by time period without having to go into each period individually on the Timesheets page. This portlet uses the actual timeslices to retrieve data. It displays the amount of time worked per week, month or quarter on projects. The user may specify the dates, time-scaled value and the project name. The portlet also provides a Total to Date, which shows the total number of actuals for that resource on that assignment.
 -
The My Time portlet provides the logged in user with the ability to view his or her time by project by time period without having to go into each period individually on the Timesheets page. This portlet uses the actual timeslices to retrieve data. It displays the amount of time worked per week, month or quarter on projects. The user may specify the dates, time-scaled value and the project name. The portlet also provides a Total to Date, which shows the total number of actuals for that resource on that assignment.
-
 Part of the Business Transformation collection, this grid portlet displays idea details for all ideas (active and inactive) and all status conditions. This is an editable portlet based on the Ideas data provider. Filterable by OBS structure, Active/Inactive, and Status.
 -
Part of the Business Transformation collection, this grid portlet displays idea details for all ideas (active and inactive) and all status conditions. This is an editable portlet based on the Ideas data provider. Filterable by OBS structure, Active/Inactive, and Status.
-
Part of the Business Transformation collection, this grid portlet displays idea details for all ideas (active and inactive) and all status conditions. This is an editable portlet based on the Ideas data provider. Filterable by OBS structure, Active/Inactive, and Status.
-
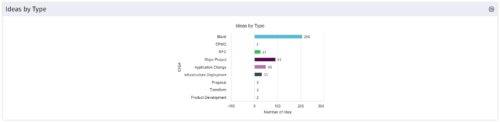 This is a great way to review demand by type and evaluate where demand is coming from and who will be impacted. Displays a bar graph of all ideas group by type.
 -
This is a great way to review demand by type and evaluate where demand is coming from and who will be impacted. Displays a bar graph of all ideas group by type.
-
This is a great way to review demand by type and evaluate where demand is coming from and who will be impacted. Displays a bar graph of all ideas group by type.
-
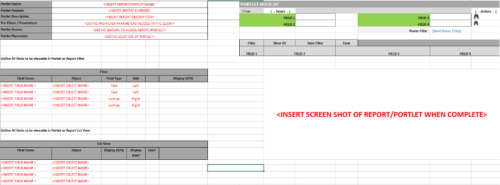 This Excel document provides a template for mocking up and validating portlet requirements. The template is important to use to help end users visualize the final output of a portlet. Template Defines:
- Portlet Name
- Portlet Purpose
- Portlet Description
- Portlet Security
- Portlet Placement
- Portlet Filter Fields/Layout
- Portlet Grid Fields/Layout
-
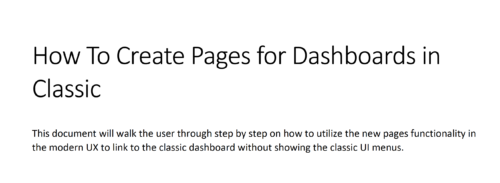 This document will walk the user through step by step on how to utilize the new pages functionality in the modern UX to link to the classic dashboard without showing the classic UI menus.
 -
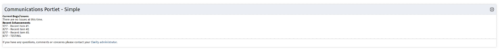 The Communications Portlet - Simple portlet provides a simple mechanism to communicate with Clarity users. The content of the porlet can be edited easily through the Portlet administration screens within Clarity. This is a very beneficial method of delivering messages to your Clarity users all at the same time.
 -
The Communications Portlet - Simple portlet provides a simple mechanism to communicate with Clarity users. The content of the porlet can be edited easily through the Portlet administration screens within Clarity. This is a very beneficial method of delivering messages to your Clarity users all at the same time.
-
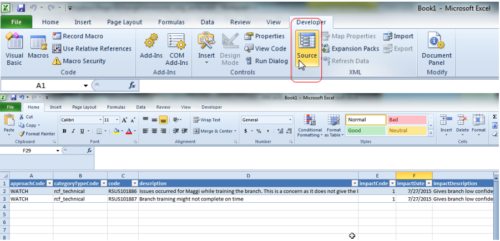 This tech trick demonstrates how to use Microsoft Excel to map data to XOG files by using the Developer tab in Excel 2010+. Using a standard XML XOG file as provided by CA the guide and walkthrough video shows off the power of Excel and the ease in which object instance values can be directly inserted into or updated in Clarity.
 -
 Looking for metrics that you can implement immediately in CA PPM? This class will be a working session to review all of the content available out of the box and within the CA and Rego content packs. This will provide you the options for metrics the represent industry best practice without the costs to develop them.
 -
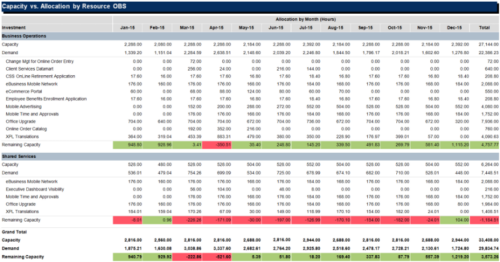
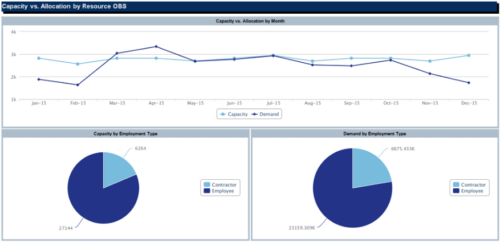 The Capacity vs Allocation by OBS report is a transaction based Jaspersoft report that does not require the Load Jaspersoft Datawarehouse job to be run. The report will pull real-time data from the transaction tables in Clarity. This report can be run from either the Advanced Reporting or Reports and Jobs area within Clarity. The Capacity vs. Allocation by OBS report displays resource capacity and demand across investments. The report can be grouped by any OBS level, providing visibility into resources at any level of the organization. The report displays amounts by week or month, and in total. The amounts can be displayed as hours or FTEs.
 -
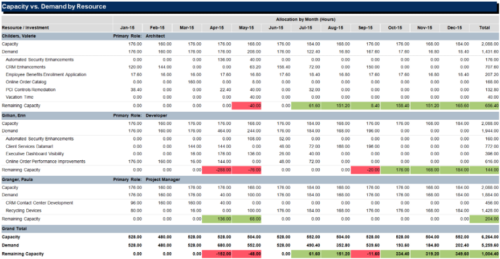 The Capacity vs Demand by Resource report is a transaction based Jaspersoft report that does not require the Load Jaspersoft Datawarehouse job to be run. The report will pull real-time data from the transaction tables in Clarity. This report can be run from either the Advanced Reporting or Reports and Jobs area within Clarity. The Capacity vs. Demand by Resource report displays resource capacity and demand at the resource level across investments. The report gives you visibility into the capacity, demand, and remaining capacity by resource. The report displays amounts by week or month, and in total. The amounts might be displayed as hours or FTEs.
 -
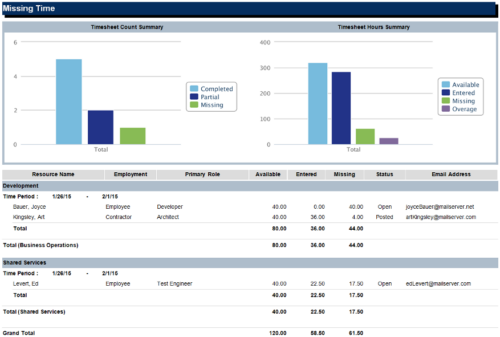 The Missing Time report is a transaction based Jaspersoft report that does not require the Load Jaspersoft Datawarehouse job to be run. The report will pull real-time data from the transaction tables in Clarity. This report can be run from either the Advanced Reporting or Reports and Jobs area within Clarity. The Missing Time report displays resource available hours, timesheet hours entered, and timesheet hours missing by resource and time period. The report can be grouped by resource manager or OBS level. The report also has an option to calculate missing time based on timesheet status or resource availability. The charts include a summary of timesheets across the periods included in the report. The Timesheet Count Summary displays the number of timesheets that are completed, partially completed, or missing for the time periods. The Timesheet Hours Summary displays the number of hours grouped by resource availability, timesheets entered, timesheets missing, and overage.
 -
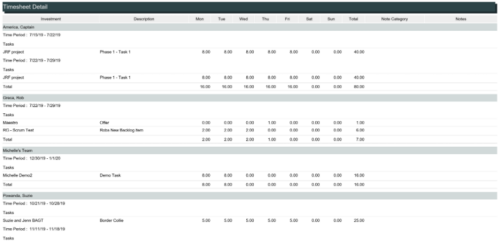 The Timesheet Detail report is a transaction based Jaspersoft report that does not require the Load Jaspersoft Datawarehouse job to be run. The report will pull real-time data from the transaction tables in Clarity. This report can be run from either the Advanced Reporting or Reports and Jobs area within Clarity. The Timesheet Detail report displays timesheet entries for a resource and time period. The timesheet entries include tasks, other time, incidents, and indirect time. The report shows the timesheet hours by day and in total, with any notes related to the time entry.
 -
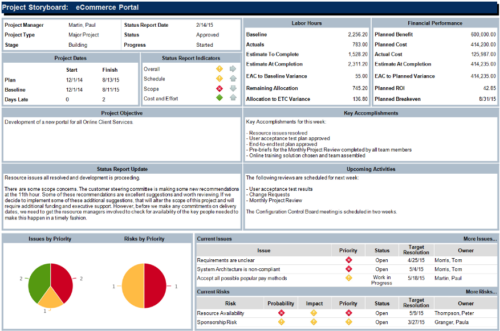 The Project Storyboard report is a transaction based Jaspersoft report that does not require the Load Jaspersoft Datawarehouse job to be run. The report will pull real-time data from the transaction tables in Clarity. This report can be run from either the Advanced Reporting or Reports and Jobs area within Clarity. The Project Storyboard report shows key aspects of a project that is organized in separate frames. Each frame in the report displays project information such as project dates, project objective, the amount, and cost of resources that are planned and actual, key accomplishments, upcoming activities, current issues and risks, and the project progress toward goals. This report can be used to analyze the project earned value and track work performance to account for cost and schedule variances.
 -
 A Quick Reference Guide on setting up Custom Investments in Clarity’s Modern UX. Reviews setting up the Custom Investment, and creating Custom Investment Records.
 -
 A Quick Reference Guide to assist in managing a Custom Investment in Clarity’s Modern UX. Reviews accessing the Custom Investment Link and navigating the tabs.
 -
 An updated version of our training material for Jaspersoft Ad-Hoc Reporting for Clarity. Introduces Jaspersoft as a reporting tool, explains security, the data warehouse, and JS Domains. Then delves into navigation, running a report, creating an ad-hoc report, saving it, creating a cross tab report, creating a chart, creating a dashboard, and scheduling the report.
 -
 A Quick Reference Guide to assist in the process of running a Jaspersoft Report. Guide walks through the steps and has screen shots to assist in the process.
 -
 A Quick Reference Guide to assist in the process of scheduling a Jaspersoft Report to run. Gives you the steps and shows screen shots to assist with the process.
 -
 A Quick Reference Guide to assist in the process of creating a table in a Jaspersoft Ad-Hoc Report. Uses screenshots to walk you through the process.


Copyright 2023 • Rego Consulting Corporation • Privacy Policy