-
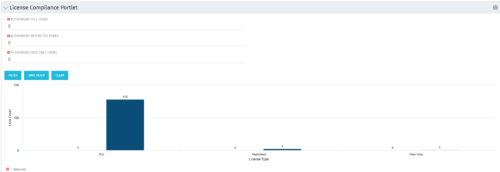 Portlet to quickly show License Compliance for all license types. Simply Enter your License Limits in the filter – The portlet will display the three license types in a grid format with compliance chart and RYG Icons.
 -
 Agile is here to stay, but waterfall may be as well. Companies around the world struggle with living in a bimodal development world, while trying to go through an agile transformation. This session will discuss best practices and lessons learned within companies that have gone through agile transformations. We will also review SAFe as a potential approach.
 -
 Does your organization own Apptio or looking to purchase it? In this session we will dive into what Apptio is and how it complements your current Clarity solution.
 -
 Has your organization made significant investments in technology solutions without seeing precise results? Do you have the right capabilities yet lack an interconnected, end-to-end solution? A holistic Ecosystem Assessment will evaluate the current state of your project management practices across People, Process, Tools and Governance to compare against industry best practice. Join Rego Expert Guides, Jacob Cancelliere and Nipun Karla, as they discuss our proven process that can help optimize your ecosystem and drive strategic results.
 -
 Are you starting a project/financial management implementation, or do you want to compare how you are using these functions vs. others or best practices? In this class we will discuss some best practices from successful customers.
 -
 MITRE will discuss the recent revival of Clarity enabled by an upgrade and elimination of on-premise non-compliant customizations and their success story. The project leader will address the steps to execute this transformation and the approach taken towards organizational change management.
 -
 Are you struggling with implementing Agile tools in your organization in addition to Clarity? This class will review best practices for implementing agile tools in conjunction with Clarity - living in a Bi-Modal world. We will discuss how Clarity can be used to govern both types of work and teams and how Agile tools should interface into Clarity.
 -
 Have you considered using Rally in conjunction with Clarity? Have you seen or heard about the OOTB connector? This class will go through the OOTB connector in detail and show how Rego has built our ad-on to enhance the connectivity between these two tools.
 -
 Rally Software introduction including high level feature and functionality for Agile and portfolio planning and tracking, analytics and reporting, and overall benefits of Rally in the marketplace along with a product demo.
 -
 Do you want to know more about building file-based integrations? Does your organization have an external BI tool like Cognos, Tableau, Domo, or Qlikview? This session will review strategies for getting data into your corporate BI tools. We will also show Rego's data extraction tool and how it can be used for all outbound file-based integrations to save money and time.
 -
 Course Description: Have you considered using Rally Software® in conjunction with Clarity PPM? Have you seen or heard about the OOTB connector? This class will go through the OOTB connector in detail and show how Rego has built addons to enhance the connectivity between these two tools.
 -
 Are you starting a demand management implementation? Do you want to compare how you are using these functions vs. how others are using them? In this class, we will discuss some best practices from successful customers.


Copyright 2023 • Rego Consulting Corporation • Privacy Policy