
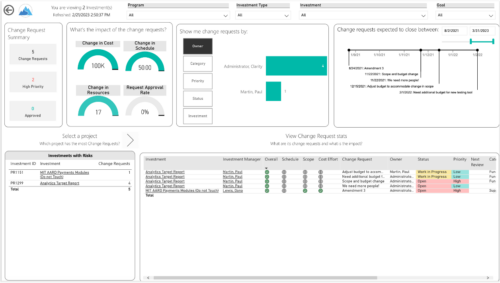
- Change Requests
- Cost Trend
- Cost
- Effort Trend
- Effort
- Hierarchy Summary
- Investment Drill Thru
- Investment Gantt
- Issue Summary
- Milestones
- Risk Summary
- Staff
- Status Report Summary
- Tasks
-
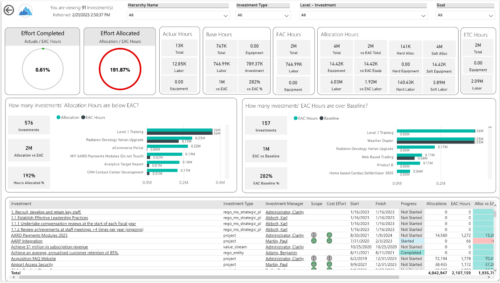
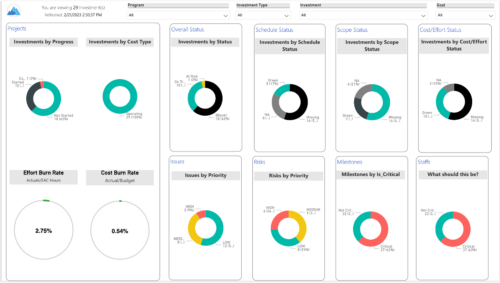
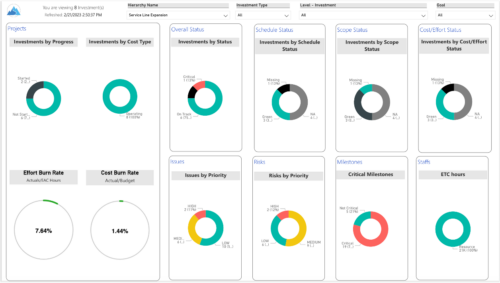 Summarize an ad hoc list of investments or leverage your defined hierarchies to visualize and evaluate the performance of your portfolios, including financial data analysis. Report Views include:
 -
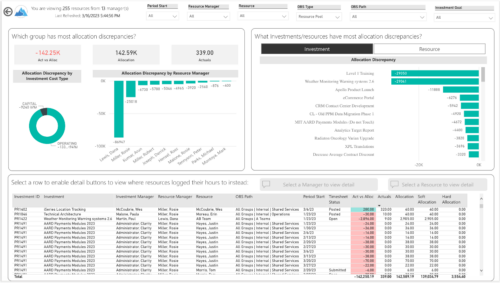
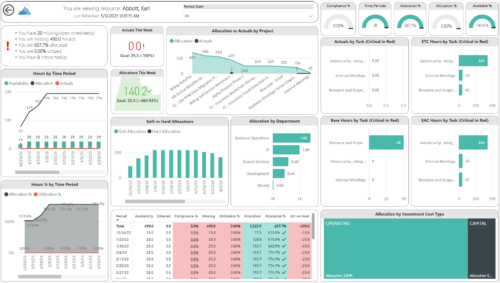
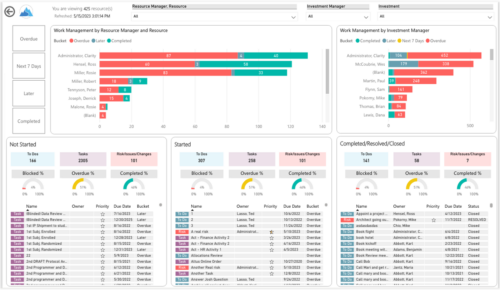
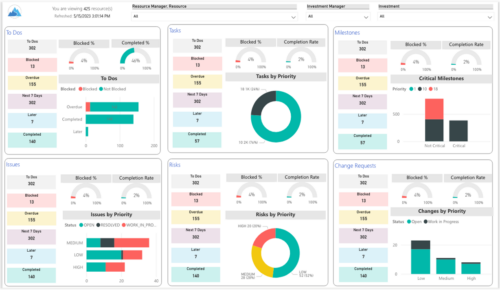
 Evaluate resource allocations, identify bottlenecks, and ensure optimal resource utilization across projects and teams. Report Views include:
- Allocation Discrepancies
- Resource Detail
- Resource Skills
- Resource Summary
- Resource Tasks
- Staffing Allocations
- Staffing ETC
-
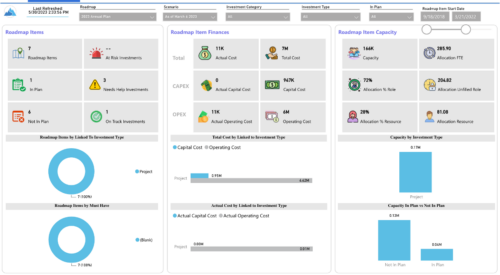
 Plan your future work by comparing different scenarios, including in-flight work, and determine the best course of action for your organization. Report Views include:
- Roadmap Details
- Resource Investment Demand
- Roadmap Financials
- Roadmap Investment Gantt
- Roadmap Item Gantt
- Roadmap Overview – Default Scenarios
- Roadmap Overview – Single Roadmap Selection
- Scenario Comparison
-
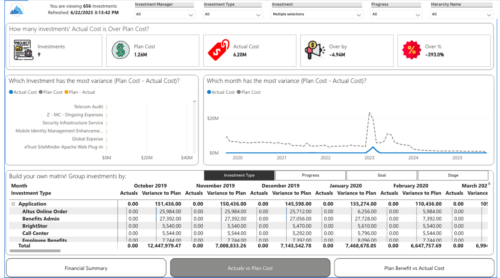
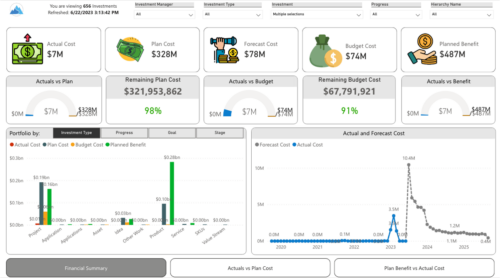 Gain a financial view of your investments by comparing actuals to planned cost and planned benefit. Report views include:
- Financial Summary
- Planned Benefit vs Actual Cost
- Actuals vs Planned Costs
-
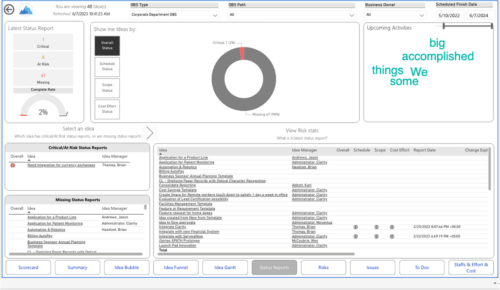
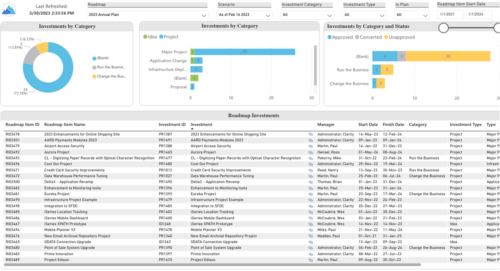
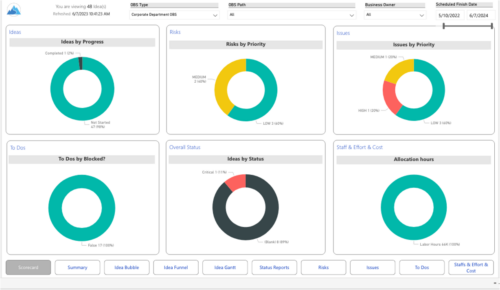 Master your pipeline as you prioritize, visualize, and analyze ideas, assess their feasibility, and track progress from inception to execution. Report Views include:
- Idea Bubble
- Idea Details
- Idea Funnel
- Idea Gantt
- Idea Overview
- Idea Staff and Effort
- Idea Status
- Idea To Dos
-
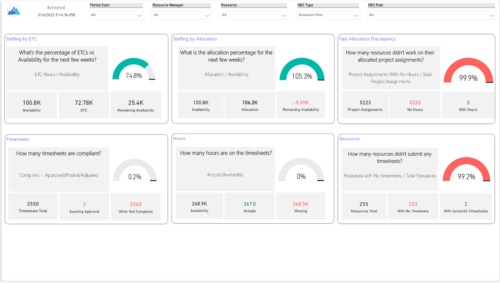
 Spot opportunities to improve timesheet accuracy and resource allocations by assessing timesheet compliance and allocation. Report Views include:
- Allocation Variance
- Capex vs Opex
- Hours Detail
- Resource Dtails
- Single Manager Drill Down
- Single Resource Drill Down
- Timesheet Detail
- Timesheet Summary
- Unapproved Timesheets
-
 Gain an overview of program-level performance, track program milestones, and assess overall program health. Report Views include:
- Change Requests
- Program Costs Trend
- Program Costs
- Program Drill Thru
- Program Effort
- Program Gantt
- Program Issues
- Program Milestones
- Program Risks
- Program Staff
- Program Status Reports
- Program Summary
- Program Tasks
-
 Make sure project deliverables are completed on time by tracking work progress and monitoring task assignments. Report Views include:
- Work Details
- Work Overview
- Work Risk Issue and Change
-
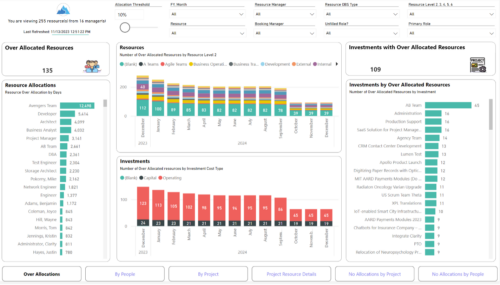
 Evaluate resource allocations, identify bottlenecks, and ensure optimal resource utilization across projects and teams. Report Views include: • Over Allocation • By Project • By People • Project Resource Details • No Allocations by Project • No Allocations by People The main .rpt file will access data through the Data Warehouse.
 -
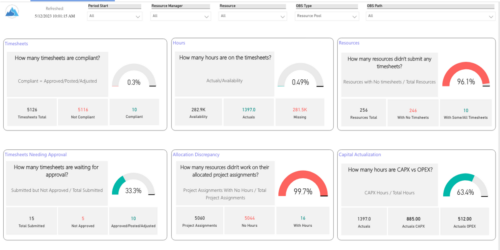
 The Adoption Dashboard is designed to enhance data integrity and project tracking within Clarity by providing insights into how well users are populating and managing their project and resource data. Features: · Project Data Quality Evaluate the accuracy of project status reporting, risk, issue tracking, and schedule adherence. · Resource Data Quality Assess how well resource managers are managing timesheets, allocations, and actual utilization. · Adoption Scoring View Rate the consistency of data entry across projects and resources on a scale of 0-5, helping identify areas needing improvement. · Variance Analysis View Track discrepancies in project schedules, effort, budgets, and resource commitments. · Compliance Monitoring Ensure that all necessary project and resource data is up-to-date, aiding in more informed decision-making and better project outcomes.
 -
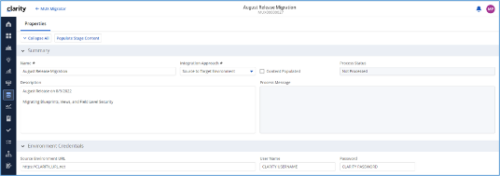
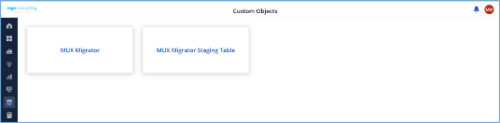
*Note: MUX Migrator v2.0 will only work on Clarity versions 16.1.0 and higher. The Migration Tool for Modern UX Components provides the ability to migrate Blueprints, Views, and Field Level Security between environments. Previously, the promotion of these components needed to be done manually. This functionality, to be utilized by an administrator, is available under the Custom Objects Area of Clarity. Source to Target Approach The user would first create an ‘MUX Migrator’ instance and populate the associated details. Once ready, they will use the “Populate Stage Content” action which will run a workflow in the background to populate a Staging Table with Source Environments content. (Blueprints, Views, and Field Level Security)Installation files are not provided with the download. While the MUX Migration Tool is free, it does require some time by Rego Technical Staff to install. Approximately 4 hours is required. If you are current Rego Customer, this time can be applied against a current project if you choose, or against an Ad Hoc SOW/PO you have in place with us. Please reach out to your friendly Rego Account Director to arrange to have the tool installed. Installation files are not provided with this download. They will be installed by our staff. If you are currently not a Rego client, we invite you to reach out to us at info@regoconsulting.com and we can arrange to set up an Ad Hoc bucket of hours for this install and any future work we can do for you. After a successful populate, they would navigate to the “MUX Configuration” module where they can decide on what content they want to migrate between environments. They can select one to many components they wish to migrate. Once the “MUX Configuration” sub-object is populated, the user can navigate back to the “Properties” module. Once a password is populated, the user can use the Actions drop-down to run the “Migrate Content to Environment” workflow. This will run a process that will migrate the content from the source environment to the target environment. JSON Approach The user would first create an ‘MUX Migrator’ instance and populate the associated details. They would navigate to the “MUX Configuration” module where they can decide on what content they want to migrate between environments. They can select one to many components they wish to migrate. Once the “MUX Configuration” sub-object is populated, the user can navigate back to the “Properties” module. The user can use the Actions drop-down to run the “Export JSON” workflow. This will run a process that will generate a .txt file located in the “JSON File” attribute. That file can be downloaded from the Source Environment. The user can then login to the Target Environment. The user would first create an ‘MUX Migrator’ instance and populate the associated details. Once the ‘MUX Migrator’ instance is created, they can upload the JSON File that was downloaded from the Source Environment. The user can use the Actions drop-down to run the “Import JSON” workflow. This will run a process that will generate read the file located in the “JSON File” attribute and load the configuration into the Target Environment. View Administration The user would first create an ‘MUX Migrator’ instance and populate the associated details. They would navigate to the “MUX View Administration” module where they can decide on what views they would like to update the creator of. They can also reset the “default” view displayed when logged in for a resource(s), Security Group(s), or Resource OBS Node(s). Prerequisites - The user will create the migrator instances/run the processes in the Target Environment they wish to migrate content to (E.g., Run this in PROD to migrate the content from a lower environment to PROD)
- Any attributes that are part of the Blueprints, Views, or Field Level Security must exist in the target environment.
- The user that is utilizing the content must have the following security rights associated to their account.
- XOG rights to all the associated objects
- View/edit security rights to the MUX Migrator Object and MUX Migrator Content Object
- oView rights to the MUX Migrator Staging Table Object
- API-Access
- Process Start or Process AutoStart – All
-
 A tech trick document that assists you in update Data Source when utilizing the Power BI reports found in RegoXchange.
 -
 Learn basic administrative tasks in this basic administration Clarity training, which includes setting up resources, security groups, OBSs, lookups, time reporting periods, fiscal time periods, calendars, jobs, and timeslices. These activities are focused on ongoing support vs. new configuration. Learn how to setup the ModernUX
 -
 Hierarchies and Roadmaps are two powerful capabilities that Clarity has brought to the market. While they work great independently, have you experimented with how they can work together, even better? In this session, come and learn how these two capabilities can complement each other by working in concert giving you both planning and execution insights!
 -
 Evaluate resource allocations, identify bottlenecks, and ensure optimal resource utilization across projects and teams. Report Views include: • Over Allocation • By Project • By People • Project Resource Details • No Allocations by Project • No Allocations by People The main file will access data through custom queries created via Rego Odata connector.
 -
 Learn advanced administrative development tasks—including Objects and Fields, Object Portlets, Basic Processes, and XOG. In the last portion of this class we will walk through the high level data model within the Clarity database and walk through some basic NSQL portlets. This is a more technical class focusing on basic configurations - designed for non-technical people.
 -
 This training document is a Rego Consulting Quick Reference Guide to assist with accessing the various project views in Clarity’s Modern User Experience. Reviews the Tile, Grid and Board views for projects.
 -
 A Rego Training deck that reviews the use of Hierarchies in Clarity PPM’s Modern UX.
- Hierarchies in Clarity PPM can be used to create one or more hierarchies that define relationships between various investments. Each hierarchy includes an investment tress card made up of multiple cards.
- A parent-child relationship between investment cards help stakeholders understand the dynamics of the investments. Stakeholders can use the Hierarchies page to view all the hierarchies in the organization.
- Hierarchies can include different investment types such as; ideas, projects, and custom investments with configurable cards by investment type.
- Hierarchies can display rolled up aggregation metrics.
- Hierarchies can be exported to PDF.
-
 Are you using Clarity's roadmap leveraging some of the best and most common practices found across industries? Come to this session to learn about how the roadmap works, out of the box. We will cover how to configure views, targets, widgets, boards and more! You will leave with great ideas you can bring back to your organization!
 -
 This session will aligning you with some of the best and most common practices for using Clarity's Resource Management capabilities. Come and learn about the cababilities that come out of the box for resource insights like allocations, assignments, availability and more. Additionally, tips and tricks will be discussed leaving you with a toolkit of ideas for your organization!
 -
 What should I expect to see within my organization related to PM over the next couple of years? How should I prepare my PMs, PMOs, or myself to embrace the new trends within the industry. This class will share Rego's observations on industry trends within PPM.
 -
 This training document is a Rego Consulting Quick Reference Guide to assist with use of the Common Grid. You can find the grid throughout the application to manage projects, tasks, roadmaps, ideas, and timesheets to name a few. The QRG reviews View Options, Column Adjustments, the Details Panel and more.
 -

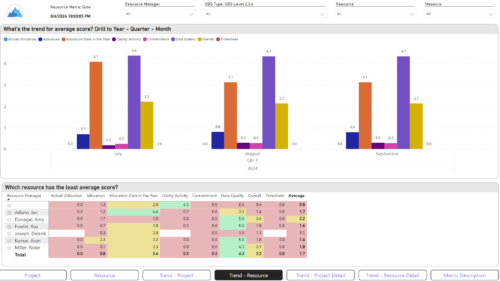
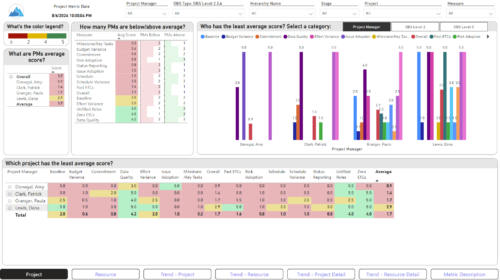
Rego’s Clarity Adoption Metrics package consists of two sets of metrics: Project metrics, and Resource metrics. Project metrics measure how effectively project managers are using Clarity to manage their projects. Resource metrics measure how effectively resource managers are using Clarity to manage resources. Metrics are scored on a scale of 0 to 5, with higher scores indicating greater adoption and use. All metrics can be viewed numerically or graphically, and can be broken out by OBS. In addition, metric data can display as a 12-month rolling history to help identify trends. Project metrics can also display by lowest / highest adoption rates for a specific resource metric or all resource metrics. There is a variety of way to view the Adoption Metric data, therefore, Rego has made this simple by creating an Adoption Metrics object that contains multiple tabs. Each tab displays one or more of the Project or Resource Adoption Metrics. Based on the nature of the Metrics some tabs will allow the ability to use a pull down menu to select a specific Adoption Metric. There is also a Metrics trending view that pulls monthly snapshots of the metrics. Project metrics consist of the following: - Project Status Reporting – Measures how well PMs create and publish project status reports.
- Project Risk Adoption – Measures how well Risks are being used and managed.
- Project Issue Adoption – Measures how well Issues are being used and managed.
- Project Schedule – Measures how well PMs create tasks and keep the project schedule current.
- Project Baseline – Measures whether or not baselines exist.
- Project Zero ETC’s – Measures how well the PM assigns resources to tasks with ETCs.
- Project Past ETC’s – Measures how many improperly scheduled tasks the PM has.
- Project Milestone / Key Tasks – Measures how well PMs create and manage Milestones / Key Tasks.
- Project Schedule Variance – Measures how effectively PMs manage their schedules.
- Project Effort Variance – Measures how effectively PMs manage their project efforts.
- Project Budget Variance – Measures how effectively PMs manage budgets or cost plans.
- Project Unfilled Roles – Measures project roles with allocations that are already started or starting within the next 30 days.
- Project Data Quality – Measures how effectively PMs complete the Description, Stage, Progress, Objective, and Sponsor/Business Owner fields.
- Project Commitment – Measures the hard allocations for a project over a two week time frame.
- Resource Clarity Usage – Measures how often users log into Clarity.
- Resource Timesheet – Measures if timesheets post in a timely manner.
- Resource Allocation – Measures how well RMs keep total resource allocations within the expected range for future time periods.
- Resource Actualy Utilization – Measures how well Resource allocations match actuals.
- Resource Allocation Date in the Past – Measures how many resources are open for time entry with dates in the past.
- Resource Data Quality – Measures how well RMs complete the Resource Manager and Primary Role fields and optionally the Skill and Employment Type fields.
- Resource Commitment – Measures how much resource available time is committed to projects.
-
 A presentation slide deck from Rego University 2021. This course covered enabling the Modern UX and timesheets, creating a link to the MUX in the classic home menu, creating Blueprints and more.
