-
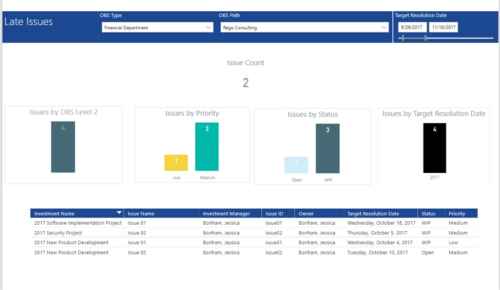 Late Issues report provides the Project Managers a single place to view all the Open Issues that are past their target resolution date. This report provides information such as Issue Count, Issues by OBS Level 2, Priority, Status and Target Resolution Date in Stacked Column Chart. In addition, this report has also Table view of Issue information such as Investment Name, Issue Name, Investment Manager, Issue ID, Owner, Target Resolution Date, Status and Priority. User can further narrow their search by OBS Type & Path and Target Resolution Date.
 -
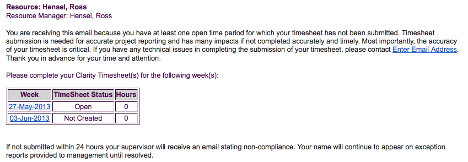 The Enhanced Time Tracking Stalker – Resource workflow process is used to notify resources who failed to submit a timesheet for the prior time period they must take action. The workflow checks for active resources (by using the hire and termination dates, their track mode and that they are open for time entry). Each resource who meet the criteria receives an email asking them to submit their outstanding timesheet(s). The email includes a table that contains this information: time period, timesheet status and any hours currently saved on the timesheet. All outstanding timesheets are included in the table with links to the timesheet in the Modern User Experience side of Clarity. This process helps to ensure the timely submission of timesheets.
 -
 This training document is a Rego Consulting Quick Reference Guide to assist with the saving and managing of Roadmap views in Clarity’s Modern User Experience. This doc references version 16.3 views. Document provides detail on the Save As feature for Roadmap views. Detail is provided on views created by others, how to manage existing views and how to save them as favorites. Timeline, Board and Grid view saving options are detailed.
 -
This training document is a Rego Consulting Quick Reference Guide to assist with creation and management of resource Teams in Clarity’s Modern User Experience. This doc references version 16.3 views. Document provides detail on how to create Teams and add resources to a Team. Instructions are provided on how to add resources by OBS and how to allocate a team to an investment. Team key points are provided with regard to Classic, Allocations, ETC and Financials.
-
 This training document is a Rego Consulting Quick Reference Guide to assist with Idea approval and conversion to projects in Clarity’s Modern User Experience. This doc references version 16.3 views. Doc reviews setting Ideas as Approved and converting Ideas to projects.
 -
 This process will update the following on Projects: • Risk/Issues/Changes • Task Assignments • Task Data • Project Team Resources • Project Data • NOTE: The ability to remove the right is with the admin only
 -

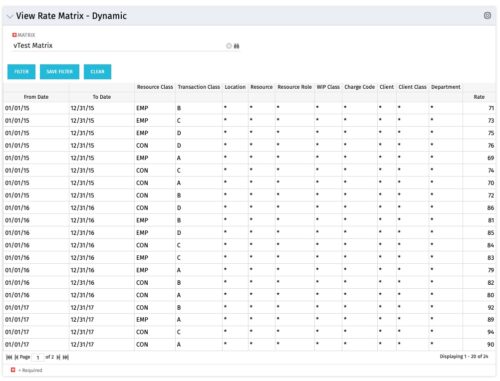 View Rate Matrix is a grid portlet that provides users a single place to view all the rates defined across multiple rate matrix without going to administration tab. Each Matrix may be defined with different columns (ex: Charge Code, Client, Department, Entity, Input type Code etc). This portlet dynamically brings only the columns associated with that rate matrix and provides the detailed information. User can view information related to one matrix at a time.
 -
 You are no longer regulated to the desktop browser to respond to action items. Learn how Rego solved this problem using just your email. We’ll talk about various use cases where you would get maximum benefit from a simple response on an action item directly from your email. It doesn’t matter if you are using email on your desktop, laptop, phone or tablet. The Action Item Responder as you covered.
 -
 A Quick Reference Guide to assist in the creation of a new Canvas in Clarity. Canvas are modules within Blueprints. These modules are able to be added within the Blueprints and define objects within the canvas by using toggles.
 -
This training document is a Rego Consulting Quick Reference Guide to assist with the creation of Risks, Issues and Changes in Clarity’s Modern User Experience. This doc references version 16.3 views. Doc covers creating and management of these project tools.
-
 This training document is a Rego Consulting Quick Reference Guide to assist with General Navigation in Clarity’s Modern User Experience. This doc references version 16.3 views. Doc reviews the Menu Bar and User Tool Bar.
 -
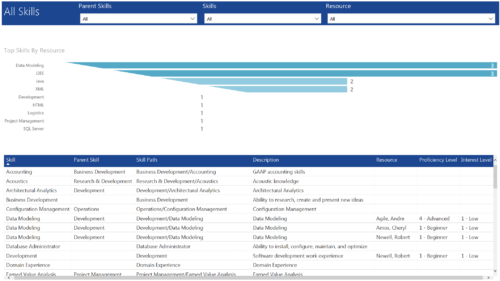 All Skills report provides project managers a single place to view number of resources having a particular skill and its detailed information. This report contains a bar graph and a grid. Top Skills by Resource: Bar graph that displays # of resources having a particular skill. Y- Axis represents various skills available in the system. Resource and Skill details grid: Grid that displays information such as Skill, its parent skill, Skill path, Skill Description, Resource having that skill & his proficiency and interest level in that skill. You can further narrow your search by Parent Skills, Skills and Resource.


Copyright 2023 • Rego Consulting Corporation • Privacy Policy