-
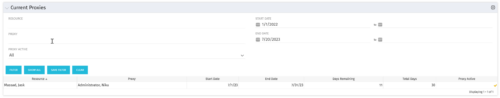 The Current Proxies portlet provides a user with an overview of all the resources in the system currently using a proxy. This portlet is helpful to determine a proxy if a user is currently out of the office. The portlet provides several pieces of information related to the resource including: resource names, proxy, start date, end date, days remaining, total days, and if the proxy is active. The user may filter by resource name, proxy name, proxy status (defaults to Yes), and start/end dates (defaults to the current date).
 -
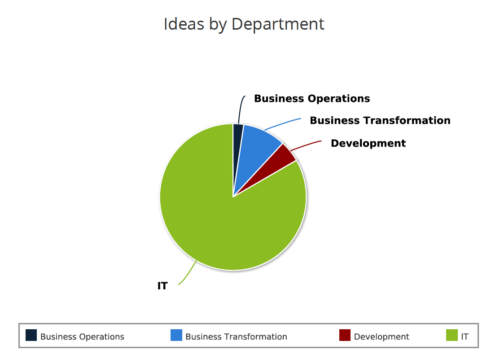 Ideas by Department report is a pie chart that displays count of ideas by department. Mouse over on the pie chart displays idea count for that department. You can further narrow your search by OBS Type & Path , Idea Status, Idea Start Date and Is Idea Active?.
 -
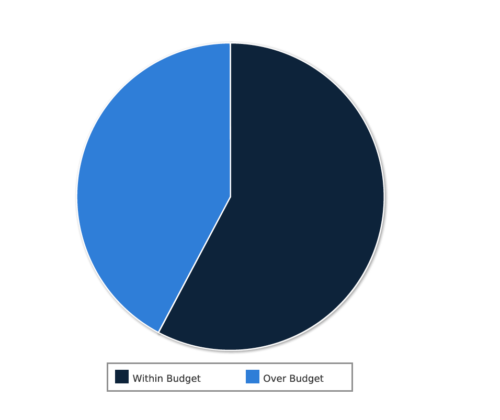 Project Cost within Budget report displays count of projects that are within or exceeding budget in the form of a pie chart. This report provides management a graphical representation of cost status on all projects. Mouse over on the pie chart displays count of projects for that category. You can further narrow your search by OBS Type & Path, Project Manager, Project Status, Project Stage, Program Name, Is project Active? And Is Template?.
 -
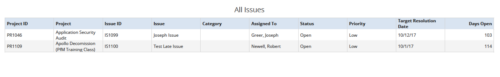 All Issues report provides the Project Managers a single place to view all the Issues across multiple projects. User can view only the projects that he has access to. This report provides Issue information such as ID, Name, Category, Assigned To, Status, Priority, Target Resolution Date and Days Open ( # of days Issue is open ) User can further narrow their search by OBS Type & Path, Issue Name, Project Name, Project ID, Is Project Active?, Issue Owner, Issue Status, Issue Target Resolution Date, Issue Category and Issue Priority.
 -
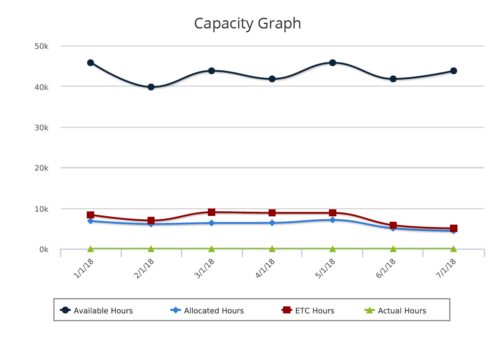 Capacity Graph report provides the Resource Managers & PMO a single place to view Monthly Availability, Allocations, Actuals and Assignments for one or more active resources. Information is displayed in the form of a line chart. Legend displays the color associated with each metric. Mouse over the line chart displays hours associated with that corresponding metric. This report provides Managers a simple means to analyze: Allocations vs. Availability, Allocations vs. Actuals, Allocations vs. ETC and ETC vs. Availability and helps in determining the areas of improvement. User can further narrow their search by OBS Type & Path, Month Start Date, Resource Name, Resource Manager, Primary Role & Employment Type.
 -
 Ideas by Business Unit report is a pie chart that displays count of ideas per business unit. This report gives a holistic view of the idea pipeline in an Organization and provides information on number of ideas converted, approved & unapproved per business unit. You can further narrow your search by Idea Status, Ideas Start Date and Is Idea Active?.
 -
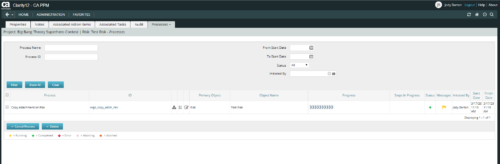 This is workflow that allows you to copy documents from one item to another. This can be altered to move documents from any place they are stored to another. In this particular instance, the focus is on moving documents from one risk to another. When creating a risk that you want to copy from, utilize the attachments section of the page and the associated lookup. The lookup is filtered to only show those risks that already have documents associated with them. Upon clicking the save button, a process runs in the background to copy the requested documents from the requested risk to this newly created risk.
 -
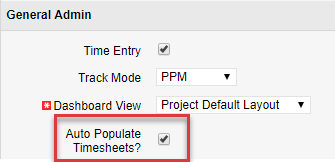
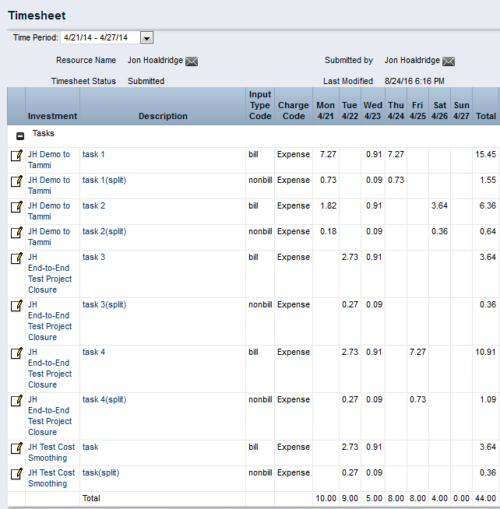
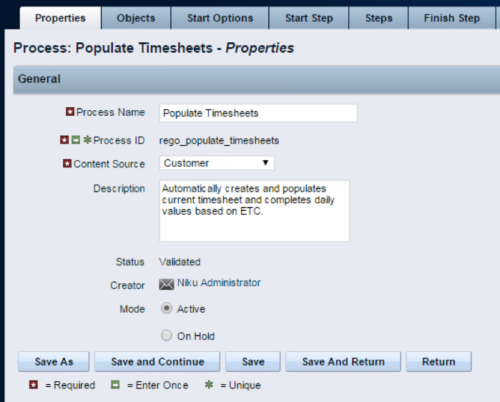 The Populate Timesheets process converts task level ETC into time entered on the timesheet. The process relies on the resource “opting in” to the process by checking a new attribute called “Auto Populate Timesheet?”, as well as the project manager “opting in” at the project level via a new attribute called “Auto Populate Timesheet?” Once the resource opts in and the PM opts in, the process will create a timesheet for the resource, pulling in the ETCs for the tasks that week and moving them to the actual hours. Once the process runs, an email will be sent to the resource letting them know the hours have been applied.
 -
 This can be used to remove all participants and their corresponding security permissions. NOTE: The ability to remove the right is with the admin only.
 -
 This can be used to remove all automatic permissions (Resource Manager Auto) granted to users as a result of becoming a resource manager. NOTE: The ability to remove the right is with the admin only
 -
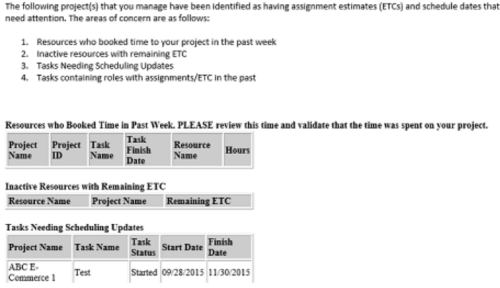 “PM Stalker – Project Validations & Issues” executes various queries against the Clarity database and sends an email to all PMs who have one or more projects with any of the following conditions:
- Resources have booked time in the past week (validation needed)
- Inactive Resources with ETCs still on the project
- Tasks past their Finish Date but not completed
- Task Role Assignments in the past
-
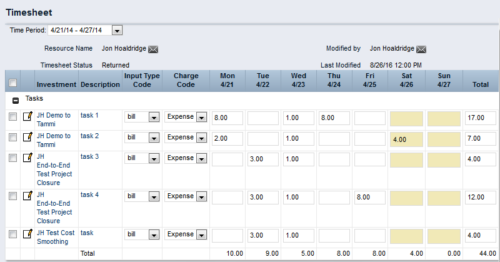 This process workflow with gel script forces billable hours on timesheet down to 40 hours, and sets overtime hours to non-billable. Timesheets with 40 or fewer hours are not touched. Process kicks off upon submission of timesheet. Steps are:
- Determine if timesheet has > 40 hours. If so, proceed.
- Create a SPLIT row for each timesheet row, with Input Type Code = Non-Bill.
- Divide 40 by total timesheet ours. Store this value.
- Multiply each timesheet cell by the stored value, and enter the result into that cell.
- Take the difference (original cell value – new cell value), and enter in same cell on Split row.
- The end result will be 40 hours total on Billable rows, and overtime hours on Non-Billable rows.


Copyright 2023 • Rego Consulting Corporation • Privacy Policy