-
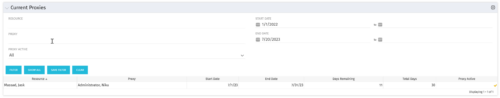 The Current Proxies portlet provides a user with an overview of all the resources in the system currently using a proxy. This portlet is helpful to determine a proxy if a user is currently out of the office. The portlet provides several pieces of information related to the resource including: resource names, proxy, start date, end date, days remaining, total days, and if the proxy is active. The user may filter by resource name, proxy name, proxy status (defaults to Yes), and start/end dates (defaults to the current date).
 -
The Current Proxies portlet provides a user with an overview of all the resources in the system currently using a proxy. This portlet is helpful to determine a proxy if a user is currently out of the office. The portlet provides several pieces of information related to the resource including: resource names, proxy, start date, end date, days remaining, total days, and if the proxy is active. The user may filter by resource name, proxy name, proxy status (defaults to Yes), and start/end dates (defaults to the current date).
-
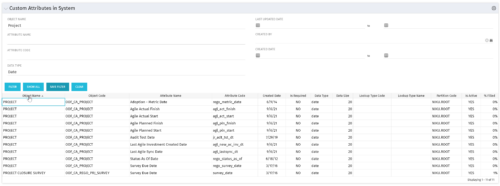 The Custom Attributes in System portlet displays all of the custom attributes present in the system and the lookup (if applicable) associated with each. This portlet is useful finding a custom attribute on an object, auditing, or for documentation purposes. The user may narrow the results by object, data type, and last updated date.
 -
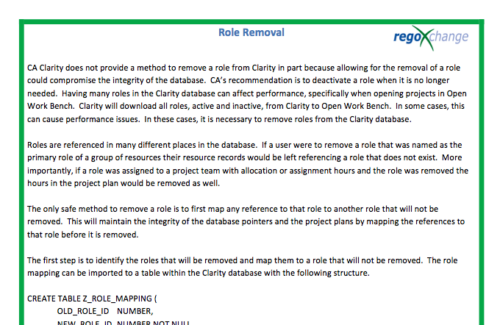 In many instances, having excess information stored within the database can cause poor performance or slowness when retrieving data. Administrators are always seeking out ways to clean and remove unused information. This technical trick on role removal provides the steps necessary to remove roles that would otherwise be unused and eliminating unwanted information. The Role Removal Technical Trick provides the information for the creation of the following tables and columns which are necessary to perform the role removal:
- Role – mapping table
- Tables / Columns that need to be updated with Resource ID fields
- Tables / Columns that need to be updated with Role Code fields
- Tables that will need to be deleted
- PRTEAM table should be checked
-
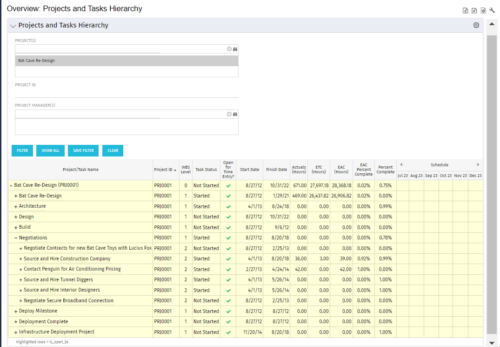 This document provides an overview of how hierarchical portlets can be exported to MS Excel. The code of a sample hierarchical portlet is explained. The included sample portlet shows a list of projects and the tasks under each project along with actual and assignment hours. The portlet can also be filtered by project and project manager.
 -
This document provides an overview of how hierarchical portlets can be exported to MS Excel. The code of a sample hierarchical portlet is explained. The included sample portlet shows a list of projects and the tasks under each project along with actual and assignment hours. The portlet can also be filtered by project and project manager.
-
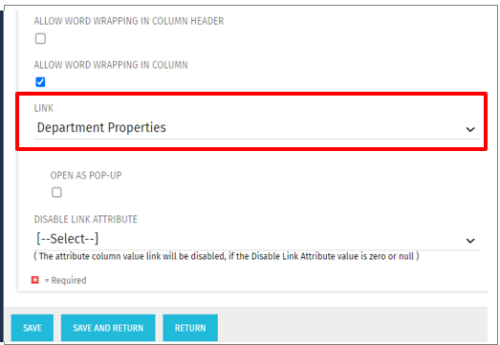 This Tech Trick allows the ability to link anywhere within the larity environment from a custom portlet link, even if it is not a standard OOTB link option. For example, you could link to a Departments page or directly to a timesheet even though these are not standard OOTB links to choose from when creating custom portlets. This trick works in Clarity versions 12, 13 , 14 and 15 for both SQL and Oracle environments.
 -

 Pie Chart displays projects by Baseline Finish Variance—is current project finish beyond baseline finish; or is current project finish on or before baseline finish. Filterable by OBS structure and Finish Date range. Data labels show percent within baseline vs percent outside baseline. Mouse-over shows Within or Outside label and percent of total projects. Legend shows color coded Within Baseline and Outside Baseline labels. Drilldown: Clicking on a pie slice yields a grid portlet of projects either Within or Outside Baseline.
 -
Pie Chart displays projects by Baseline Finish Variance—is current project finish beyond baseline finish; or is current project finish on or before baseline finish. Filterable by OBS structure and Finish Date range. Data labels show percent within baseline vs percent outside baseline. Mouse-over shows Within or Outside label and percent of total projects. Legend shows color coded Within Baseline and Outside Baseline labels. Drilldown: Clicking on a pie slice yields a grid portlet of projects either Within or Outside Baseline.
-
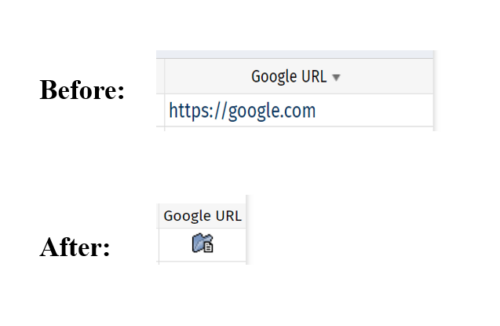 This tech-trick defines how a URL attribute can be changed to an image in a list view via CSS.
 -
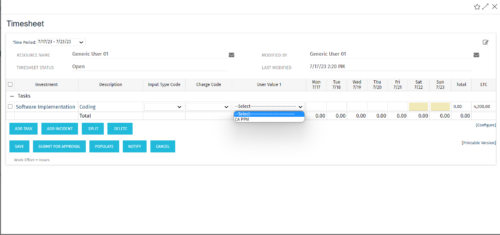 The tech-trick shows how to retrieve logged in User related values (ex: skill set) in timesheet.


Copyright 2023 • Rego Consulting Corporation • Privacy Policy