-
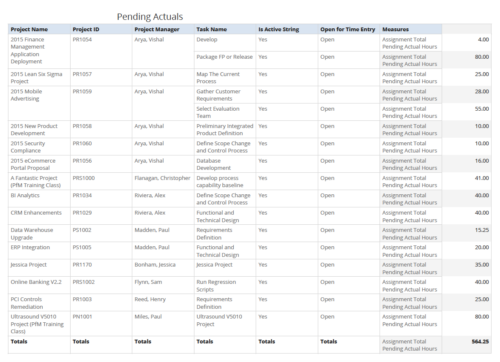 Pending Actuals report provides the Project Managers a single place to view all the pending actuals on tasks across multiple projects. User can view only the projects that he has access to. Managers can use this portlet to analyze the actuals that have been submitted but not posted on tasks. You can further narrow your search by OBS Type & Path and Assignment Total.
 -
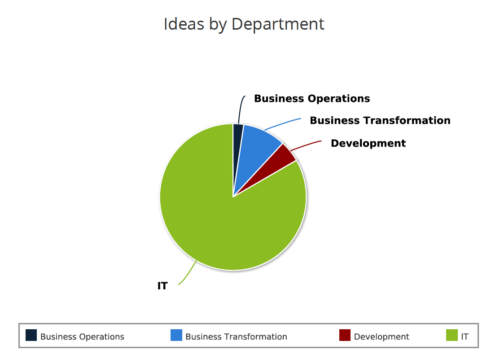 Ideas by Department report is a pie chart that displays count of ideas by department. Mouse over on the pie chart displays idea count for that department. You can further narrow your search by OBS Type & Path , Idea Status, Idea Start Date and Is Idea Active?.
 -
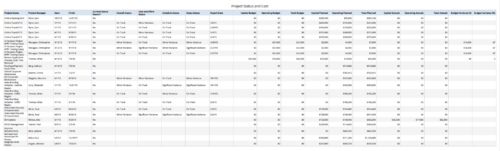 Project Status and Costs report gives the Project Manager a single place to view various Project Statuses ( Cost and Effort, Schedule, Scope and Overall ) and Costs ( Planned, Budget & Actuals ) for multiple projects. User can further narrow their search by OBS Type & Path, Project Name, Project Manager and Is Project Active?.
 -
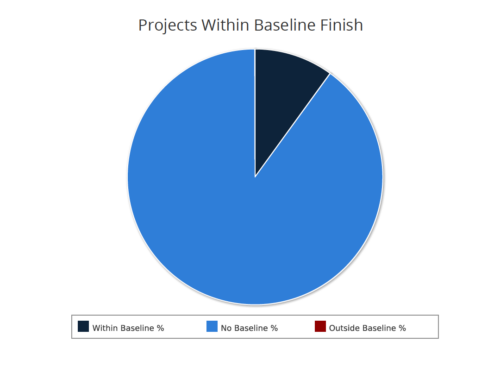 Projects within baseline finish report is a pie chart that displays projects that have a baseline or do not have a baseline. Projects with baseline are further segregated into within or outside baseline finish. Mouse over on the pie chart displays the % of projects within a particular category. You can further narrow your search by OBS Type & Path, Project Finish Date and Is Project Active?.
 -
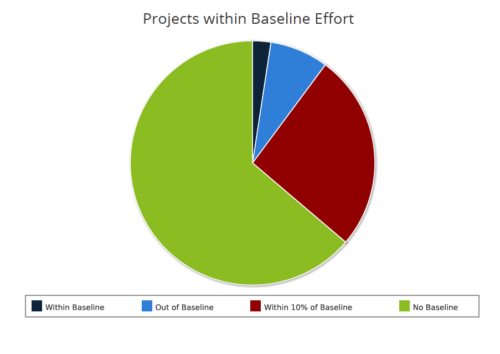 Projects within baseline effort report is a pie chart that displays projects baseline effort by their categories. Legend displays various baseline effort categories: Within Baseline, Out of Baseline, Within 10% Baseline and No Baseline. Mouse over on the pie chart displays the total number of projects within that particular category. You can further narrow your search by OBS Type & Path and Is Project Active?.
 -
 The Financial Summary by Transaction Class provides a visual graph for each year’s financial picture for multiple years. Report contains the following items: KPIs: Displays total benefit, capital, expense and net cash flow for the selected filter criteria Grid: Displays year wise break up of benefit, capital, expense and net cash flow for the selected filter criteria Graph: Benefit, capital, expense and net cash flow are depicted in graphical way for multiple years. This report will show the user where they need to concentrate their efforts in order to meet financial commitments. User can further narrow their search by OBS Type & Path.
 -
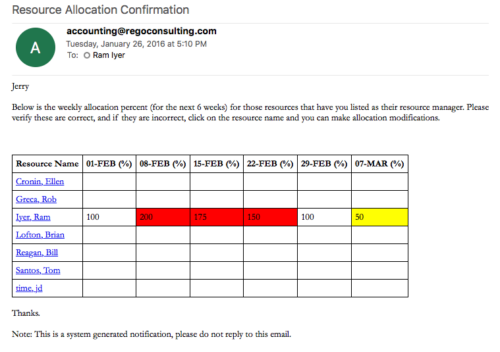 Process provides the RM with assigned resources availability percentage for the next four weeks. Grid displays all resources with their total allocated hours by week, and an average availability percent (4 Wk Avail %) for next four weeks. If % Available is negative, this indicates an over-allocation. Zero% Average Availability indicates fully allocated (no remaining availability). Links at the resource name allow for modifications by the RM.
 -
Process provides the RM with assigned resources availability percentage for the next four weeks. Grid displays all resources with their total allocated hours by week, and an average availability percent (4 Wk Avail %) for next four weeks. If % Available is negative, this indicates an over-allocation. Zero% Average Availability indicates fully allocated (no remaining availability). Links at the resource name allow for modifications by the RM.
-
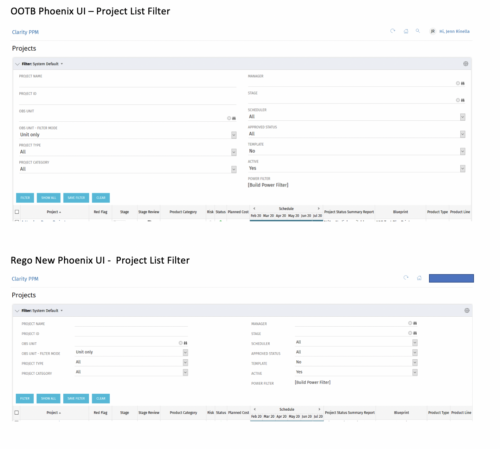
 Cleaner Phoenix UI Theme is very little padding and property sheet attributes are row based not column based.
 -
 The Creating Dependent Lookups Based On Other Fields On The Same Page document provides the steps needed to allow a user to create lookups whose values are dependent on other fields on the same page. Having the ability to use a lookup field whose list of values change based on other fields values on the same page can help reduce the number of fields that might be required and provide more relevant options to the user based on other data selections.
 -
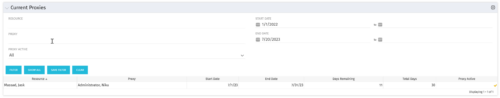 The Current Proxies portlet provides a user with an overview of all the resources in the system currently using a proxy. This portlet is helpful to determine a proxy if a user is currently out of the office. The portlet provides several pieces of information related to the resource including: resource names, proxy, start date, end date, days remaining, total days, and if the proxy is active. The user may filter by resource name, proxy name, proxy status (defaults to Yes), and start/end dates (defaults to the current date).


Copyright 2023 • Rego Consulting Corporation • Privacy Policy