-
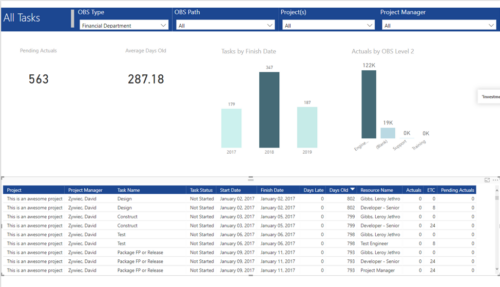 All Tasks report provides project managers a single place to view KPIs related to Tasks. All the KPIs are depicted in various visualizations. Pending Actuals: Scorecard that displays the # of Actuals that are still open and not yet posted. Average Days Old: Scorecard that displays the average number of Task Days Old. Days Old is the difference between Task Finish date and Today’s Date (when Today’s Date > Task Finish date. In other cases, it is zero) Tasks by Finish Date: Column chart that displays # of Tasks by Year of Finish date. X axis display Calendar years. Data labels indicate the number of Tasks finish date within that year. Actuals by OBS level 2: Column chart that displays sum of Task Actuals by OBS level 2. X axis display OBS level2. Data labels indicate the Actuals within that OBS level2. Grid: Displays Risk details such as Project Name, Project Manager, Task Name, Task Status, Start Date, Finish Date, Days Late, Days Old, Actuals, ETC and Pending Actuals Days Late is the difference between Task Finish date and Baseline Finish Date (when Baseline Finish Date > Task Finish date. In other cases, it is zero) You can further narrow your search by OBS Type, OBS Path, Project(s) and Project Manager.
 -
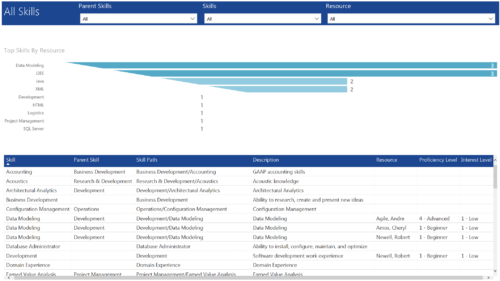 All Skills report provides project managers a single place to view number of resources having a particular skill and its detailed information. This report contains a bar graph and a grid. Top Skills by Resource: Bar graph that displays # of resources having a particular skill. Y- Axis represents various skills available in the system. Resource and Skill details grid: Grid that displays information such as Skill, its parent skill, Skill path, Skill Description, Resource having that skill & his proficiency and interest level in that skill. You can further narrow your search by Parent Skills, Skills and Resource.
 -

The Transaction Adapter – is a text based CSV file which automates the importing of monthly non labor financial data into Clarity directly from your financial system. This integration eliminates the need to create non-labor transactions manually in Clarity and will provide more accurate project, program, and portfolio financial reporting. -
This course will provide an overview of CA PPM Demand Management functionality. Topics include: - What is Demand Management?
- Accessing and Creating Ideas
- Staffing the Idea Team
- Creating and Approving Idea Financial Plans
- Idea Conversion to another Investment Type
- Accessing and Creating Incidents
- Adding Incident Tasks to a Project
-
 Rego’s training video that walks through the Time Entry and Approval process for Clarity PPM – Modern User Experience. This video was created using Clarity PPM version 15.6.
 -
 Review of functional and technical changes to Clarity from version 16.3.1 through 16.4.0. Some previous decks are available if you need to see further back in the versions. You can request them via the Librarian or emailing suport@regoxchange.com.
 -
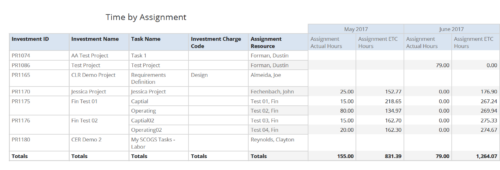 Time by Assignment report displays time logged to assignments and its associated actuals on monthly basis for all filtered investments. It also displays total ETC and Actual hours associated with an assignment. User can further narrow their search by OBS Type & Path, Investment Type, Investment Charge Code, Investment Name, Task Name, Resource Name, Assignment Start Date and Assignment Finish Date. User can use exact dates or relative dates for Assignment Start and Finish Dates filter parameters.
 -
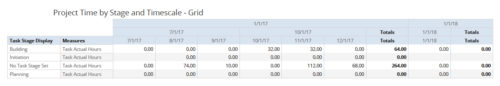 Time by Stage and Timescale – Grid report displays hours for all tasks on projects by their stage for a user-defined time period. Information can be drilled down to Year, Quarter or Monthly level. Using this report, Management can determine if excess time is being spent on a certain task stage within a project You can further narrow your search by Month Start Date, OBS Type & Path, Is Project Active? And Is Template?
 -
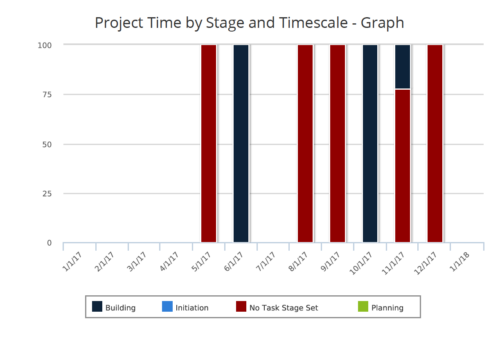 Time by Stage and Timescale – Graph report is a stacked column chart that displays hours for all tasks on projects by their stage for a user-defined time period. Using this report, Management can determine if excess time is being spent on a certain task stage within a project You can further narrow your search by Month Start Date, OBS Type & Path, Is Project Active? And Is Template?
 -
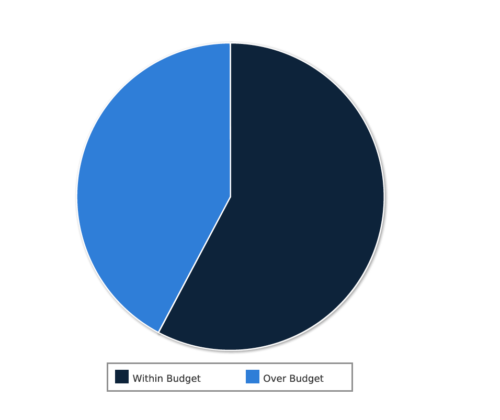 Project Cost within Budget report displays count of projects that are within or exceeding budget in the form of a pie chart. This report provides management a graphical representation of cost status on all projects. Mouse over on the pie chart displays count of projects for that category. You can further narrow your search by OBS Type & Path, Project Manager, Project Status, Project Stage, Program Name, Is project Active? And Is Template?.
 -
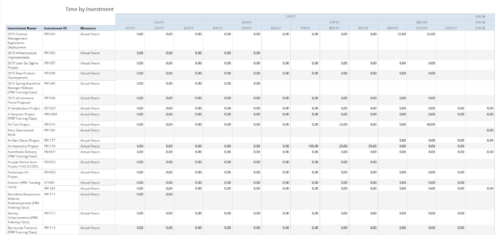 Time by Investment report displays time spent by resources on investment(s). User can view only the investments that he has access to view. Information can be drilled to Yearly, Quarterly or Monthly level. User can further narrow their search by OBS Type & Path, Investment Name, Month Start Date and Is Project Active?.
 -
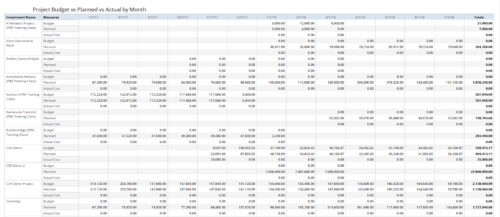 Project Budget vs Planned vs Actual by Month report provides the Project Managers a single place to view Project Budget, Planned and Actual Cost for multiple projects. Project Managers can use this view to compare various costs for that project in a particular month. User can further narrow their search by OBS Type & Path, Is Project Active?, Fiscal Month Start Date, Investment Manager and Investment Name.


Copyright 2023 • Rego Consulting Corporation • Privacy Policy