-
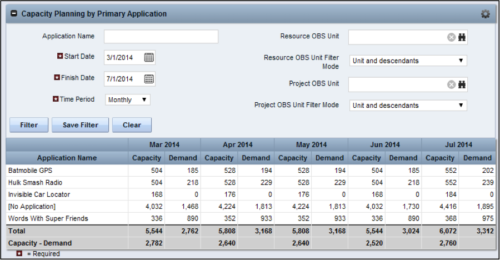 The Capacity Planning by Primary Application portlet displays the capacity and demand by primary application for a selected timeframe. This portlet is used to determine which applications are in high demand, being used efficiently, and how much capacity may be remaining for the time period. The portlet may be filtered by application name, resource OBS or project OBS to narrow the results. The timeframe can be set to display daily, weekly, monthly, quarterly, or annually.
 -
The Capacity Planning by Primary Application portlet displays the capacity and demand by primary application for a selected timeframe. This portlet is used to determine which applications are in high demand, being used efficiently, and how much capacity may be remaining for the time period. The portlet may be filtered by application name, resource OBS or project OBS to narrow the results. The timeframe can be set to display daily, weekly, monthly, quarterly, or annually.
-
 This portlet displays Actual Time by Project over a span of time. It supports Annual, Quarterly, Monthly, and Weekly time periods. The time span displayed is controlled by a filter field for the Start Date (of the time span) and by a filter field for the Number of Time Periods to be displayed. There are also filters for Project name, Project Manager, and Project Type.
 -
This portlet displays Actual Time by Project over a span of time. It supports Annual, Quarterly, Monthly, and Weekly time periods. The time span displayed is controlled by a filter field for the Start Date (of the time span) and by a filter field for the Number of Time Periods to be displayed. There are also filters for Project name, Project Manager, and Project Type.
-
 The Financial Summary by Transaction Class - Graph provides a visual graph for each years financial picture beginning with current year and going forward into the future. It will show the user where they need to concentrate their efforts in order to meet financial commitments.
 -
The Financial Summary by Transaction Class - Graph provides a visual graph for each years financial picture beginning with current year and going forward into the future. It will show the user where they need to concentrate their efforts in order to meet financial commitments.
-
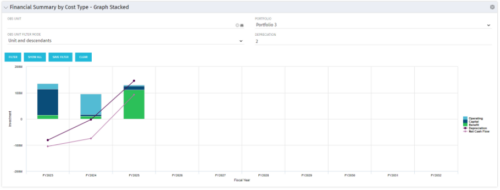 The Financial Summary by Cost Type - Graph Stacked provides a visual stacked graph for each years financial picture beginning with current year and going forward into the future. It will show the user where they need to concentrate their efforts in order to meet financial commitments.
 -
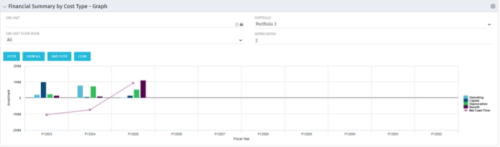 The Financial Summary by Cost Type - Graph provides a visual stacked graph for each years financial picture beginning with current year and going forward into the future. It will show the user where they need to concentrate their efforts in order to meet financial commitments.
 -
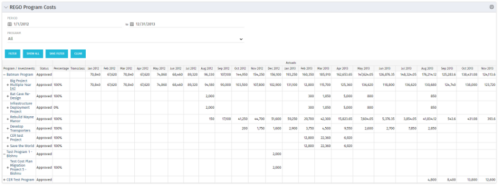 The Program Costs portlet looks like a cost plan. It will summarize all cost plans from projects within the program and display the totals.
 -
The Program Costs portlet looks like a cost plan. It will summarize all cost plans from projects within the program and display the totals.
-
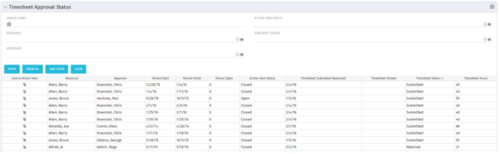 Portlet to show the stage of any Action Item triggered by Timesheet submission. Portlet allows for a period start date input, filters by Resource, Approver, Action Item Status and Timesheet Status. A link to the action item is provided for direct action by review if needed. This portlet is only for the clients who have established a process that triggers on Timesheet Status change to Submitted and to send Action Items to the person responsible for timesheet approval/validation i.e. PM for project tracking and/or RM for overall approval of the timesheet. The portlet won’t display any data if there are no timesheet Action Items. Examples of such processes would be CA’s OOTB Project Manager Approval or the Timesheet Approval - PM and RM process found on RegoXchange.
 -
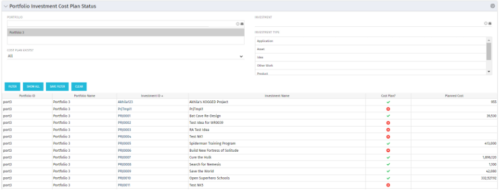 The portlet shows which investments within a portfolio has a cost plan and those that do not. For the ones which do have a cost plan, the Cost Plan? Field shows a Green checkmark. For the ones which do not have a cost plan, the Cost Plan? Field shows a Red cross.


Copyright 2023 • Rego Consulting Corporation • Privacy Policy