-
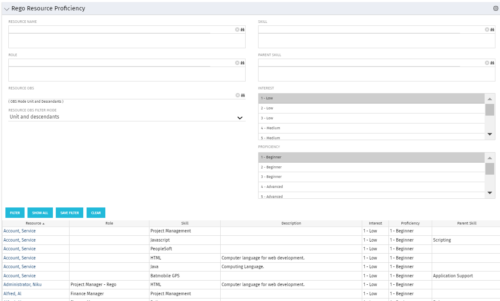 This grid displays Skill Proficiency and Interest Level by Resource. Users can utilize this view to search for Resources by Skill, Parent Skill, Interest, Role, Parent Role, Resource and Resource OBS. This portlet grants a Project Manager or Resource Manager the ability to determine which Resources best fit the needs for their project.
 -
This grid displays Skill Proficiency and Interest Level by Resource. Users can utilize this view to search for Resources by Skill, Parent Skill, Interest, Role, Parent Role, Resource and Resource OBS. This portlet grants a Project Manager or Resource Manager the ability to determine which Resources best fit the needs for their project.
-
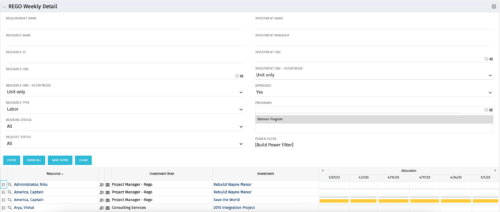 This is the same portlet as the out of the box Weekly Detail with an additional filter element for Program (multiple select). Portlet displays resource allocations graphically for each project in the specified program(s), for the next six weekly periods. Portlet filterable by numerous project, resource, and assignment attributes. Graphical representation shows Resource Availability Threshold and Allocation in hours, as a mouse-over.
 -
This is the same portlet as the out of the box Weekly Detail with an additional filter element for Program (multiple select). Portlet displays resource allocations graphically for each project in the specified program(s), for the next six weekly periods. Portlet filterable by numerous project, resource, and assignment attributes. Graphical representation shows Resource Availability Threshold and Allocation in hours, as a mouse-over.
-
 The portlet shows the Overall Status and Budget Status and Amounts. It displays one row per project. The portlet shows the following main fields: Overall Status, Budget Status, Capital Budget, Operating Budget, Total Budget, Capital Planed, Operating Planned, Total Planned, Capital Actuals, Operating Actuals, Total Actuals, Budget Variance ($), Budget Variance (%) Displaying the budget variance allows the PM to understand of the project is over / under spent, and thus the costs planning needs to be re-visited.
 -
The portlet shows the Overall Status and Budget Status and Amounts. It displays one row per project. The portlet shows the following main fields: Overall Status, Budget Status, Capital Budget, Operating Budget, Total Budget, Capital Planed, Operating Planned, Total Planned, Capital Actuals, Operating Actuals, Total Actuals, Budget Variance ($), Budget Variance (%) Displaying the budget variance allows the PM to understand of the project is over / under spent, and thus the costs planning needs to be re-visited.
-
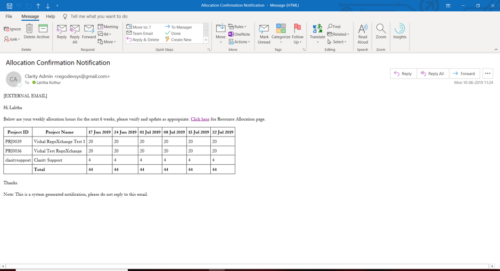 A Process run via Execute a Process job; sends an email to active resources, containing a facsimile of their Resource Allocation Detail page. It shows the next six weeks of allocations by investment, with a column total. The email also contains a click here link to this page in CA PPM, to enable editing of the data, as appropriate.
 -
A Process run via Execute a Process job; sends an email to active resources, containing a facsimile of their Resource Allocation Detail page. It shows the next six weeks of allocations by investment, with a column total. The email also contains a click here link to this page in CA PPM, to enable editing of the data, as appropriate.
-
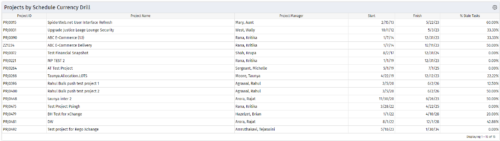
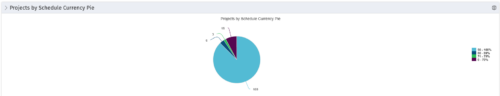 Pie Chart Portlet displays counts of active projects with various Stale ratings. Calculation is Percent Stale Tasks = number of open (not completed) tasks with a finish date over 15 days old, divided by total open tasks. Filterable by OBS structure and project manager. Data label = project count. Mouse-over and Legend labels = stale rating. More than 90% Stale means 90 to 100% of open tasks on a project have finish dates older than 15 days. More than 80% Stale means 80 to 89% of open tasks on a project have finish dates older than 15 days. Less than 70% Stale means fewer than 70% of open tasks on a project have finish dates older than 15 days. By clicking on pie slice, a drilldown grid portlet appears with listing of projects and their Stale Ratings.
 -
Pie Chart Portlet displays counts of active projects with various Stale ratings. Calculation is Percent Stale Tasks = number of open (not completed) tasks with a finish date over 15 days old, divided by total open tasks. Filterable by OBS structure and project manager. Data label = project count. Mouse-over and Legend labels = stale rating. More than 90% Stale means 90 to 100% of open tasks on a project have finish dates older than 15 days. More than 80% Stale means 80 to 89% of open tasks on a project have finish dates older than 15 days. Less than 70% Stale means fewer than 70% of open tasks on a project have finish dates older than 15 days. By clicking on pie slice, a drilldown grid portlet appears with listing of projects and their Stale Ratings.


Copyright 2023 • Rego Consulting Corporation • Privacy Policy