-
 Rally Software introduction including high level feature and functionality for Agile and portfolio planning and tracking, analytics and reporting, and overall benefits of Rally in the marketplace along with a product demo.
 -
 Do you want to add REST interfaces to your Clarity instance? We’ll walk you through specific custom interface examples in GEL and showcase Rego’s Data Processor REST capabilities you can leverage to reduce the time and cost of implementation.
 -
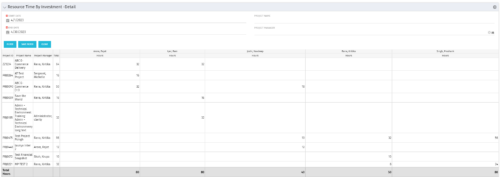 The Resource Time by Investment Detail portlet gives the Resource Manager the ability to search for time reported by resources against investments. The portlet provides filters for specific dates, a particular project and/or Project Manager. Using this portlet, the RM can get an overview of all data in a time period, the overall time logged to a project and the breakdown of his or her resources’ hours on that project.
 -
The Resource Time by Investment Detail portlet gives the Resource Manager the ability to search for time reported by resources against investments. The portlet provides filters for specific dates, a particular project and/or Project Manager. Using this portlet, the RM can get an overview of all data in a time period, the overall time logged to a project and the breakdown of his or her resources’ hours on that project.
-
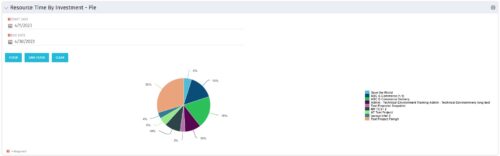 The Resource Time by Investment - Pie portlet shows a graphical representation of the time spent on investments for all resources where the logged in user is selected as the resource manager. The portlet gives the Resource Manager the ability to quickly view all time reported by resources against projects. The portlet filters between specific dates using the daily actuals timeslice. The pie chart provides a graphical view as to how time is divided across projects.
 -
The Resource Time by Investment - Pie portlet shows a graphical representation of the time spent on investments for all resources where the logged in user is selected as the resource manager. The portlet gives the Resource Manager the ability to quickly view all time reported by resources against projects. The portlet filters between specific dates using the daily actuals timeslice. The pie chart provides a graphical view as to how time is divided across projects.
-
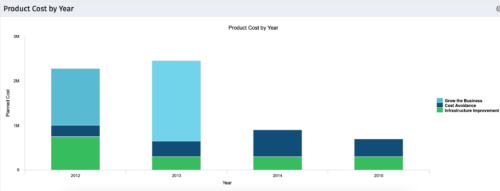 The Product Cost by Year portlet displays active product cost by year, summarized by goal. The product cost is pulled from the product’s planned cost and is displayed by year, with colors representing each product goal. This portlet provides management with a quick overview of all product costs without having to navigate to each product individually.
 -
The Product Cost by Year portlet displays active product cost by year, summarized by goal. The product cost is pulled from the product’s planned cost and is displayed by year, with colors representing each product goal. This portlet provides management with a quick overview of all product costs without having to navigate to each product individually.
-
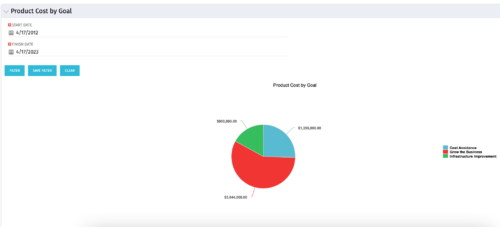 The Product Cost by Goal portlet displays the planned cost of all active products within a timeframe, summarized by goal in a pie chart. This portlet provides management with a quick overview of cost by goal within a year without navigating to each product individually.
 -
The Product Cost by Goal portlet displays the planned cost of all active products within a timeframe, summarized by goal in a pie chart. This portlet provides management with a quick overview of cost by goal within a year without navigating to each product individually.


Copyright 2023 • Rego Consulting Corporation • Privacy Policy