-
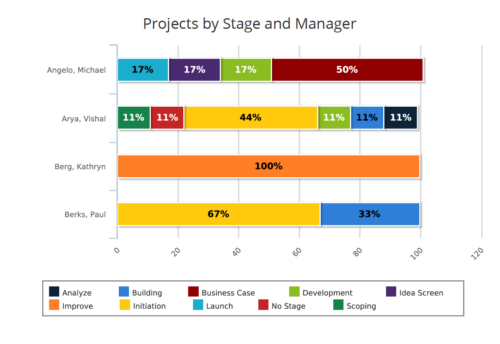 Projects by Stage and Manager report is a stacked bar chart that displays percentage of projects associated with project manager at a particular stage. Legend displays colors used to represent various Project Stages. This report provides to PMO a quick snapshot of where certain projects are sitting with each Project Manager. You can further narrow your search by Project Manager, Project Name, Is Project Active? , Is Template? And Is Program?
 -
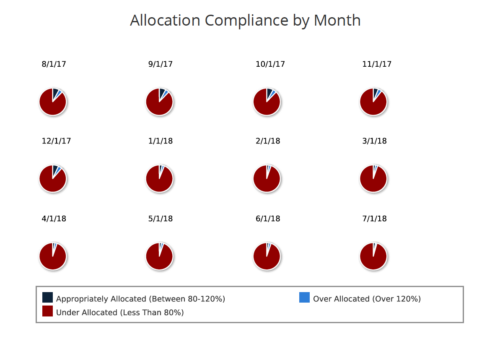 Allocation Compliance Pie Chart provides the resource manager a single place to view the Monthly Resource Allocation compliance for all resources in the form of a Pie chart. A separate Pie chart is displayed for each month. Allocation Compliance is calculated based on the value of 'Availability to Allocation Hours %'. Allocation Compliance is 'Under Allocated (Less Than 80%)' WHEN 'Availability to Allocation Hours %’ is less than 80. Allocation Compliance is 'Appropriately Allocated (Between 80-120%)' WHEN 'Availability to Allocation Hours %' is between 80 and 120. Allocation Compliance is 'Over Allocated (Over 120%)' WHEN 'Availability to Allocation Hours %' is greater than 120. User can further narrow their search by Resource Is Active? , OBS Type, OBS Path and Month Start Date. User can use exact dates or relative dates for Month Start Date filter parameter.
 -
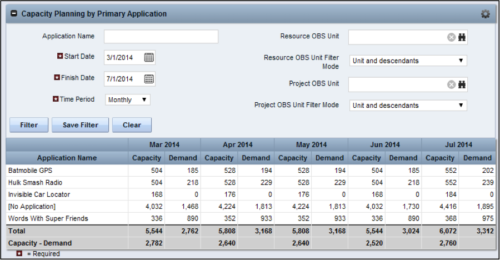 The Capacity Planning by Primary Application portlet displays the capacity and demand by primary application for a selected timeframe. This portlet is used to determine which applications are in high demand, being used efficiently, and how much capacity may be remaining for the time period. The portlet may be filtered by application name, resource OBS or project OBS to narrow the results. The timeframe can be set to display daily, weekly, monthly, quarterly, or annually.
 -
The Capacity Planning by Primary Application portlet displays the capacity and demand by primary application for a selected timeframe. This portlet is used to determine which applications are in high demand, being used efficiently, and how much capacity may be remaining for the time period. The portlet may be filtered by application name, resource OBS or project OBS to narrow the results. The timeframe can be set to display daily, weekly, monthly, quarterly, or annually.
-
 The CA Clarity Hidden Page WSDL document provides an overview of how to access the system documentation page for you CA Clarity application from the web.
 -
 A Rego Base Training Course that reviews the Jaspersoft Ad Hoc Reporting features. Elements include an Overview, Accessing Advanced Reporting, Running a Report, Running an Ad Hoc Report, Saving and Accessing a Saved Report, Creating a Cross Tab View, Creating a Chart, Creating a Dashboard, and Scheduling a Report.
 -
 This portlet displays Actual Time by Project over a span of time. It supports Annual, Quarterly, Monthly, and Weekly time periods. The time span displayed is controlled by a filter field for the Start Date (of the time span) and by a filter field for the Number of Time Periods to be displayed. There are also filters for Project name, Project Manager, and Project Type.
 -
This portlet displays Actual Time by Project over a span of time. It supports Annual, Quarterly, Monthly, and Weekly time periods. The time span displayed is controlled by a filter field for the Start Date (of the time span) and by a filter field for the Number of Time Periods to be displayed. There are also filters for Project name, Project Manager, and Project Type.
-
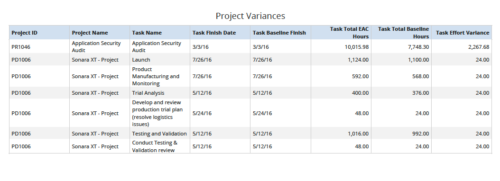 Project Variances is a grid chart that provides project managers a single place to view baseline variance at task level for various projects. This report helps managers analyze how projects are progressing against their baselines and helps them in taking correcting measures if required. You can further narrow your search by OBS Type, OBS Path, Project ID, Task Finish Date, Task Total EAC to Baseline Hours variance, Task Total EAC to Baseline Hours variance%, Task Total Baseline Hours, Task Total EAC Hours and Is Project Active?
 -
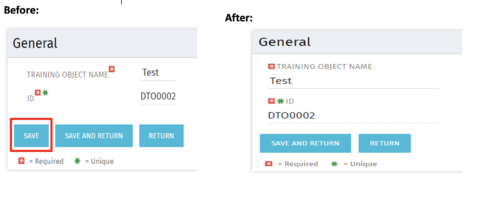 Often, you would want to disallow users from making edits to stay on the same page after changing the data by clicking Save. By forcing the users to click Save and Return, they are forced out of the page. For the above-mentioned reason, the Clarity admin can add the code in the attached tech-trick document, and that will hide the Save button from being displayed.


Copyright 2023 • Rego Consulting Corporation • Privacy Policy