-
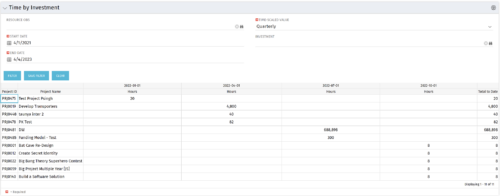 The Time by Investment portlet displays time logged to investments for all investments the logged in user has security rights to view using data from timeslices. It is capable of displaying the data by annual, quarterly, monthly, weekly, and daily segments with totals per date also being presented. The portlet may can be filtered by investment, resource OBS, and time segments. This portlet can be used as a management and governance tool to review aggregate hours posted to investments by time period.
 -
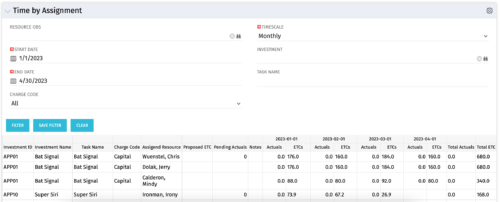 The Time by Assignment portlet displays time logged to assignments for all investments the logged in user has security rights to view - pulling data from the timeslices. It is capable of displaying the data by weekly, monthly or quarterly segments. The portlet may also be filtered by investment and resource OBS.
 -
 The Time by Assignment portlet displays time logged to assignments for all investments the logged in user has security rights to view - pulling data from the timeslices. It is capable of displaying the data by weekly, monthly or quarterly segments. The portlet may also be filtered by investment and resource OBS.
 -
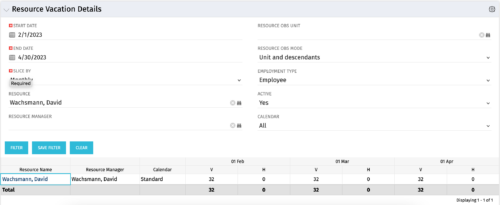 The Resource Vacation Details portlet allows a resource manager, or administrator, to see a resource’s calendar at a glance, displayed by week or month for a selected time period. This portlet shows the Resource Name, Resource Manager, Calendar, H (holiday), and V (vacation) hours for the select time frame.
 -
 The Resource Vacation portlet allows a resource manager to view a resource’s current annual vacation allowance, as set by the resource manager, against the resource’s vacation calendar hours and actual posted timesheet hours. This portlet is useful for determining the amount of hours a resource has requested off and has remaining. This portlet also ensures the resource has accounted for all annual vacation allowance hours in the calendar and has posted time for all past calendar request hours.
 -
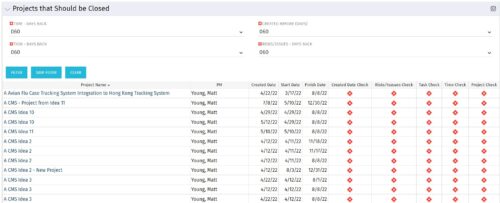
The Projects That Should Be Closed portlet displays all projects that have been created before the specified filter date and has had no new time, tasks, or risks/issues updated after the dates specified in the filter. This can assist in identifying projects that are completed or cancelled and should be closed. The table below describes the available columns in the portlet. Column Label Description Project Name Name of the project PM Manager of the project Created Date Created Date of the project Start Start Date of the project Finish Finish Date of the project Created Date Check Identifies if the project meets the Created Before (Days) filter Risks/Issues Check Identifies if the project meets the Risk/Issues – Days Back filter Task Check Identifies if the project meets the Task – Days Back filter Time Check Identifies if the project meets the Time – Days Back filter Project Check Identifies if the project meets the portlet filter Criteria id Internal code used by the query -
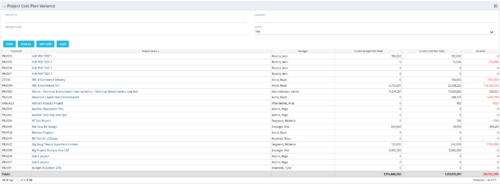 The Project Cost Plan Variance displays the variance between the budget and cost plans for projects the logged in user has security rights to view. The total for the Cost Plan that is marked as the Plan of Record for the project (Current Cost Plan Total), alongside the total for the current approved Budget Plan (Current Budget Plan Total). These two values are then compared in order to generate the total current Variance for the project. A positive amount in the Variance column indicates the project is under budget, while a negative amount indicates the project is over budget. Results may be filtered by: Project ID, Project Name, Manager, and whether the project is Active (Yes, No, All). By default, the portlet will display only Active projects.
 -
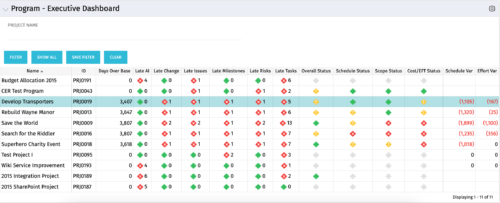 The Program Executive Dashboard portlet displays information regarding sub-projects on a program. It provides a one-stop place for the PMO or management to view all critical information about projects under a specific program. The portlet displays status indicators, dates for late items, variances and days over base, it also displays the project status fields from the Status Report sub-object.
 -
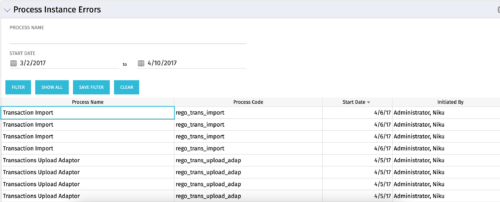 The Process Instance Errors portlet will show all processes that error. This portlet will assist the administrator with determining which processes are in error and whether to skip, retry, or cancel. It will display the process name, code, start date, and who initiated the process. You may also filter by any of the criteria listed in the grid.
 -
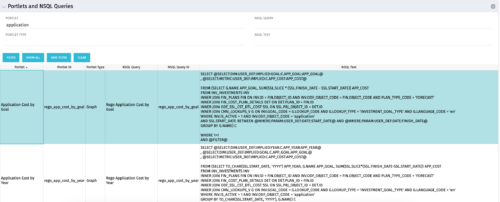
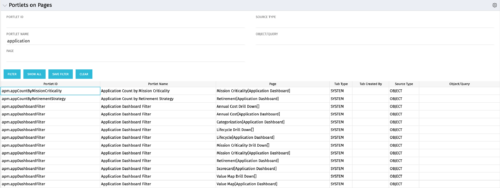 Portlets on Pages displays portlets located on each page within Clarity. This portlet is useful for administrators to determine which users have customized their pages and if they are not seeing a certain portlet, or if a user has placed a portlet on another page and needs help locating it. It also shows the portlet code, name, page the portlet resides on, tab type, who created the tab, source type, and the object/query.

